KPI Progress Tracker PowerPoint Templates
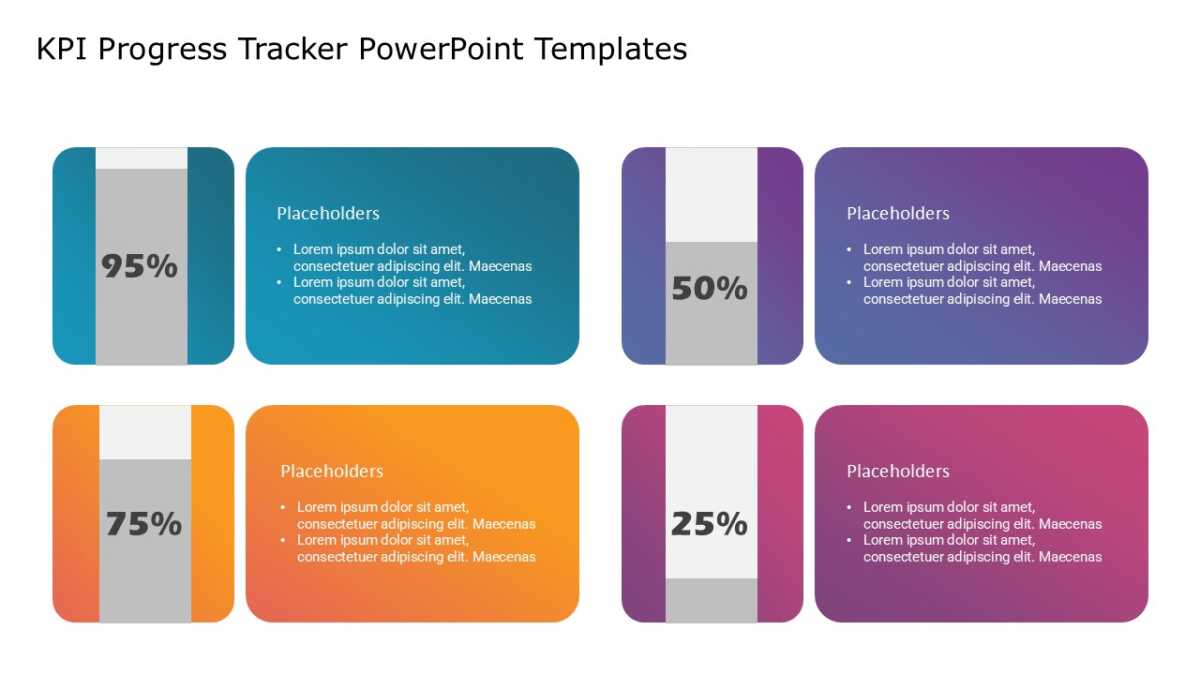
The KPI Progress Tracker PowerPoint Templates answers “how are we doing” before anyone has to ask.
The point of a finance slide is not to show every figure. It is to show the shape of the figures clearly enough that questions get specific.
What’s on the slide
- A grid of metric tiles
- A large figure and label in every tile
- A short note field beneath each number
- Consistent tile sizing for clean scanning
- Trend or progress indicators per metric
Nothing here is a flattened image. Shapes, fills, icons and text are individually editable, at 16:9, and the file behaves in Google Slides and Keynote too.
The usual audience is FP&A teams, with controllers and finance managers not far behind. Place it first, so the detail after has something to hang on. Browse the dashboard templates to compare a few layouts before committing.