Quarterly Goal Tracking Timeline PowerPoint Presentation
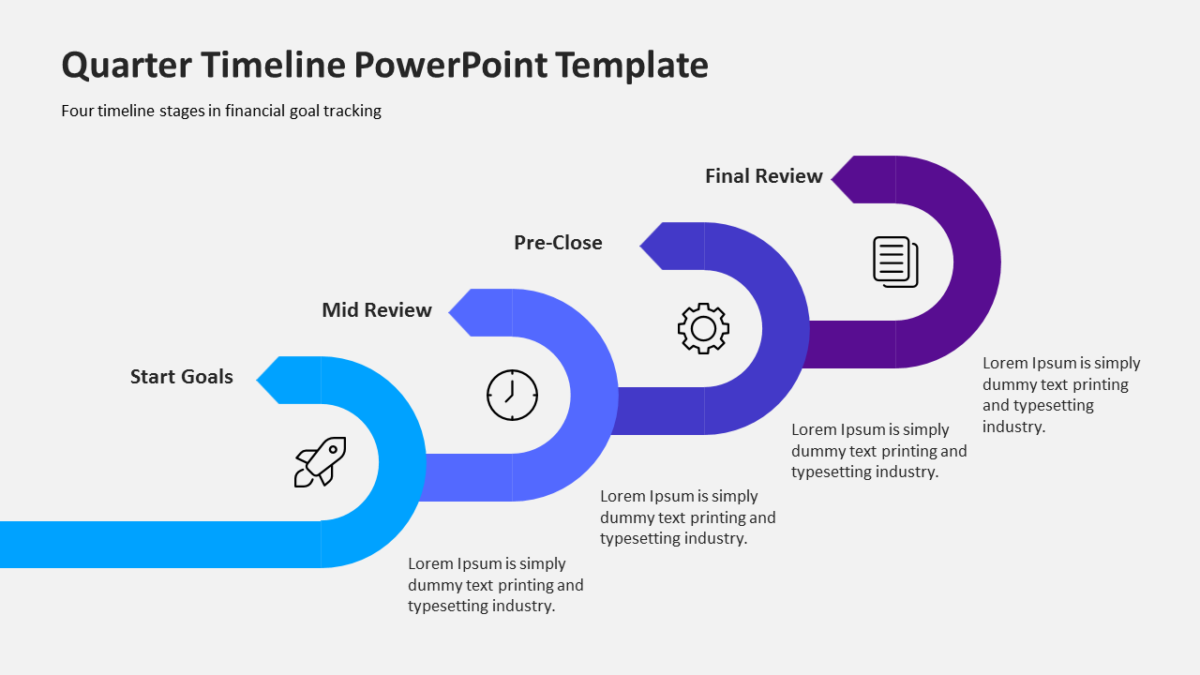
A schedule in a table is a document. A schedule on the Quarterly Goal Tracking Timeline PowerPoint Presentation is a conversation.
Finance audiences are the most skeptical in any room and the quickest to spot a slide that hides something. Clean structure signals that the numbers underneath are equally tidy.
What’s on the slide
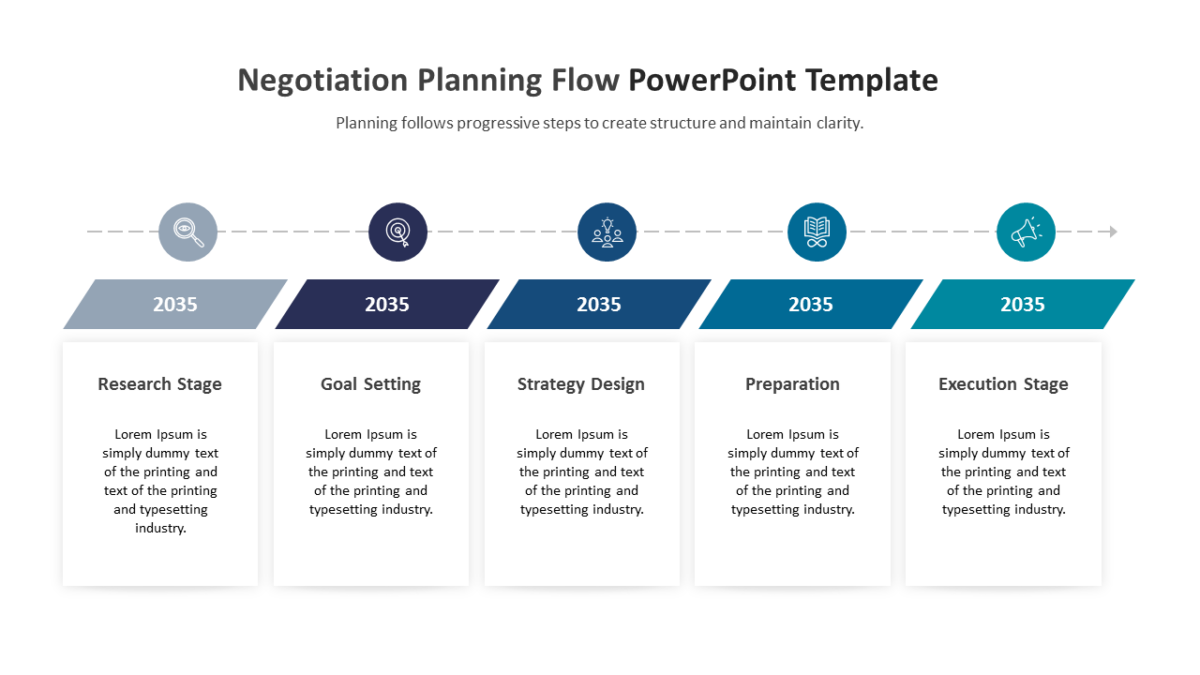
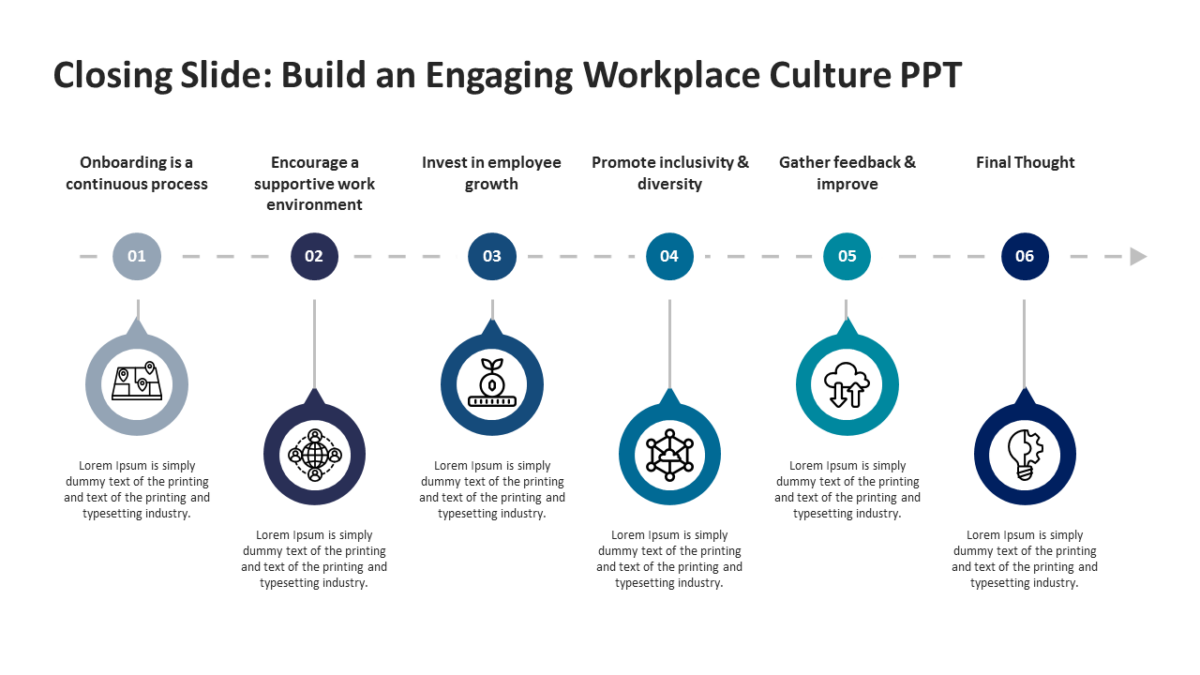
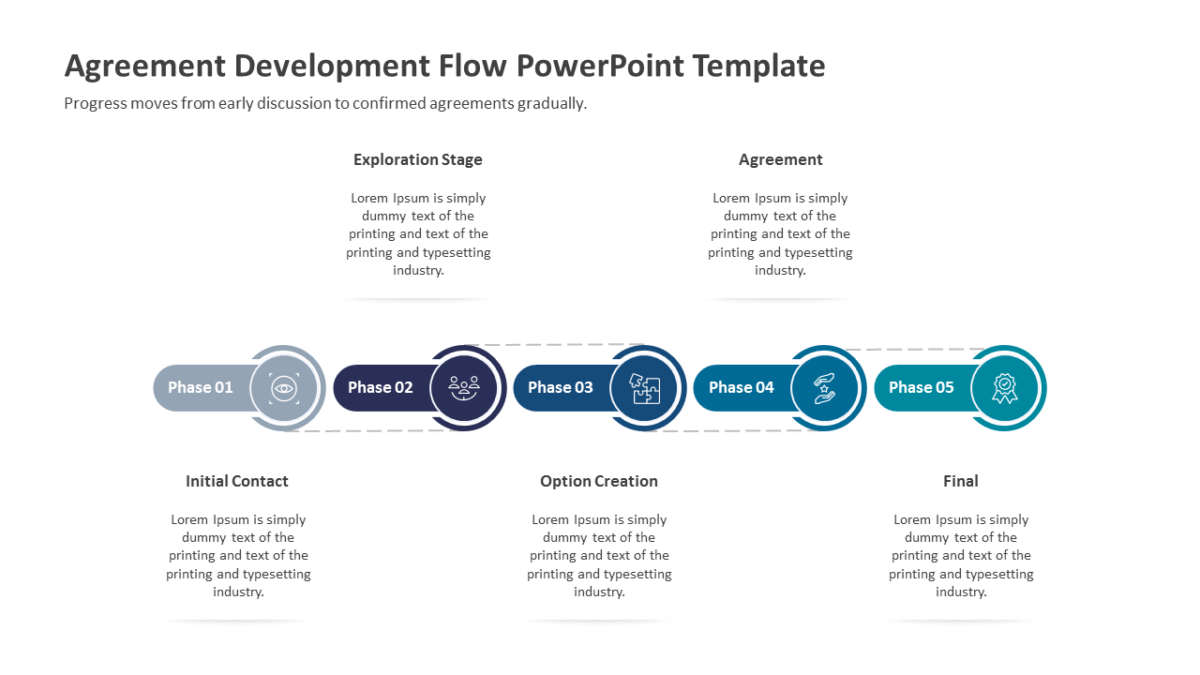
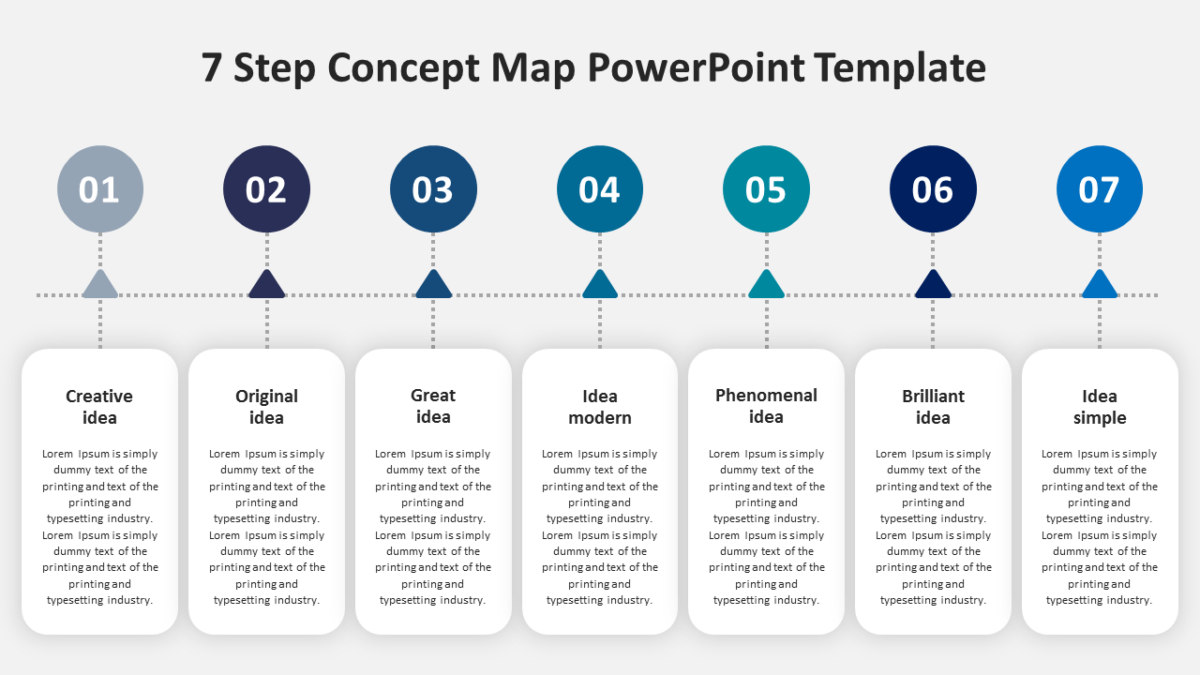
- A horizontal timeline axis with marked points
- Date or period labels on every marker
- Alternating callout cards above and below the line
- Icon slots at each point on the track
Recoloring it to your brand takes a minute, because every shape is editable rather than pasted in. 16:9 widescreen, and it travels fine to Google Slides and Keynote.
FP&A teams will use it most often. So will controllers, and it holds up for finance managers too. Put it wherever you would otherwise say “here is how this played out.” If the count is wrong for your content, the other business strategy templates cover the same ground.