6 Month Gantt Chart for Project Timeline Management
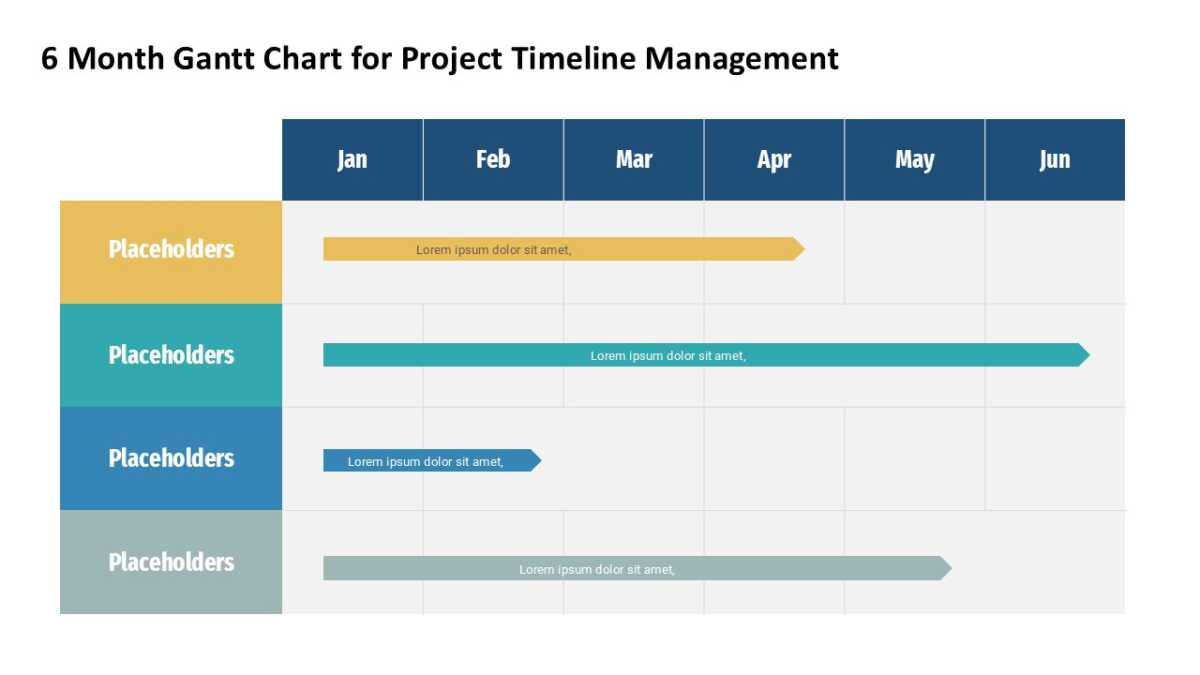
Progress is easier to defend when it is drawn. The 6 Month Gantt Chart for Project Timeline Management draws it.
The gap between a plan that exists and a plan the team follows is usually a communication gap. Making the structure visible closes most of it.
What’s on the slide
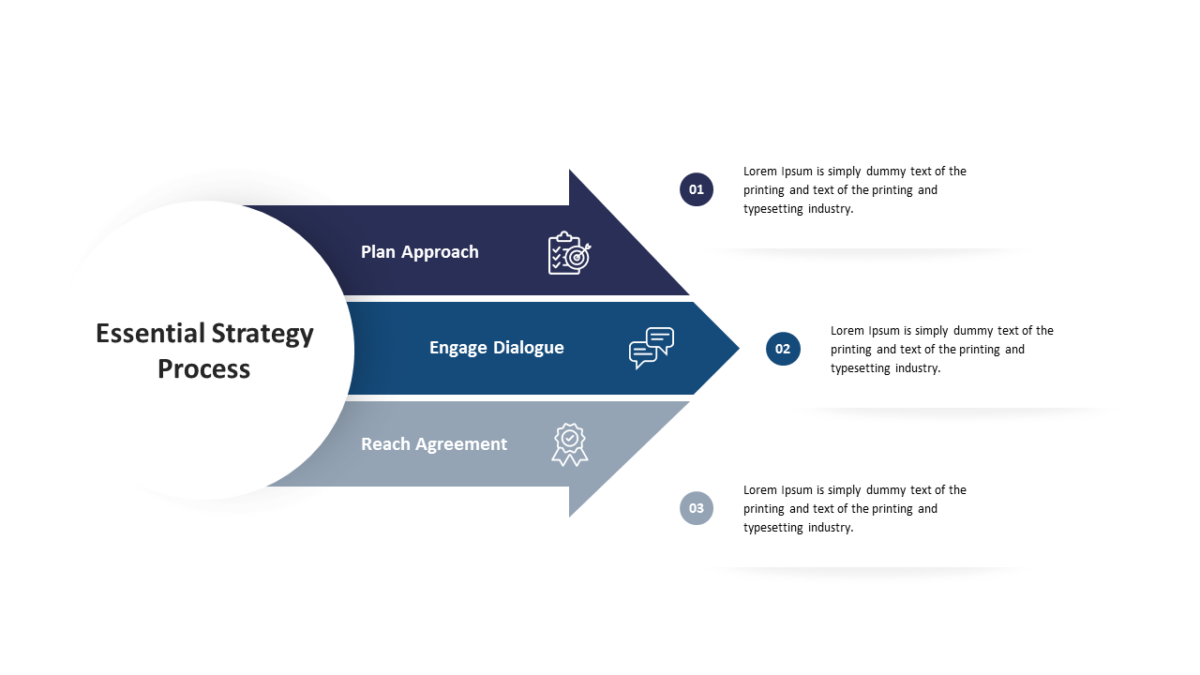
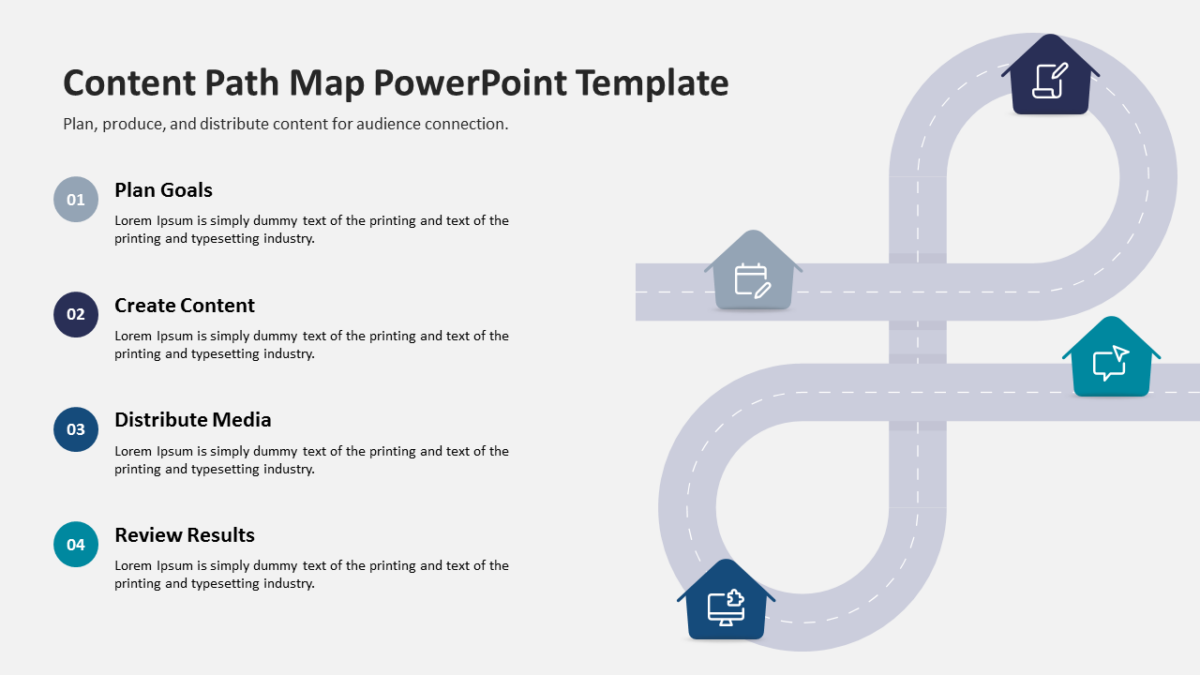
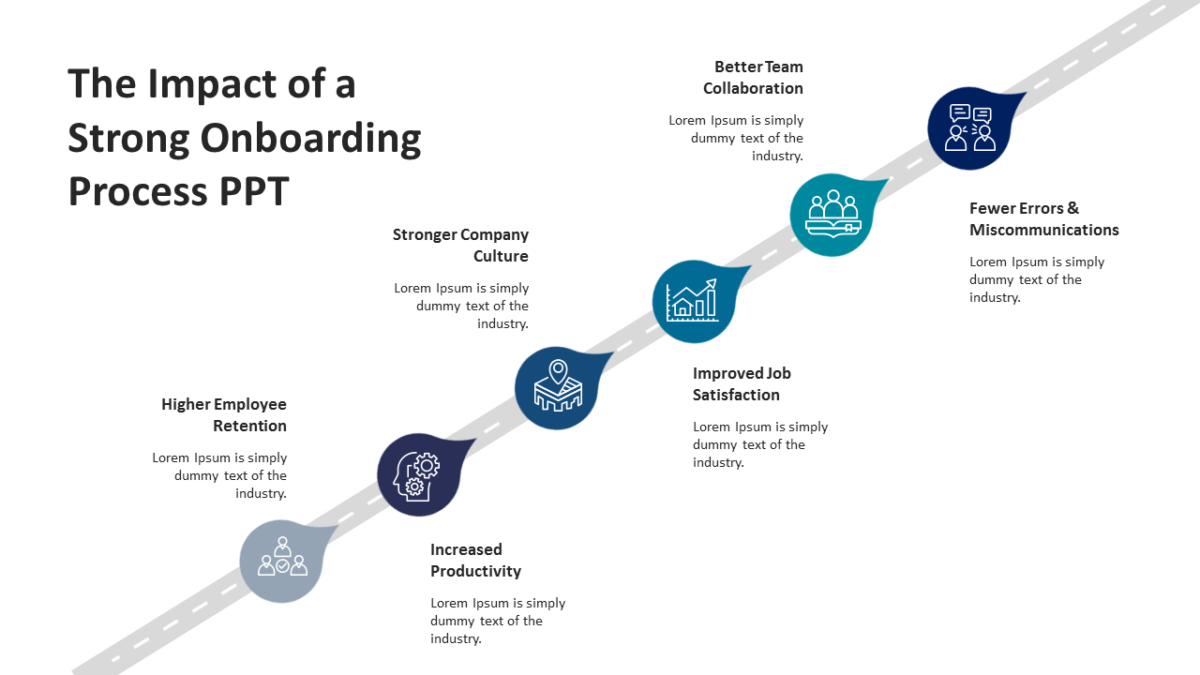
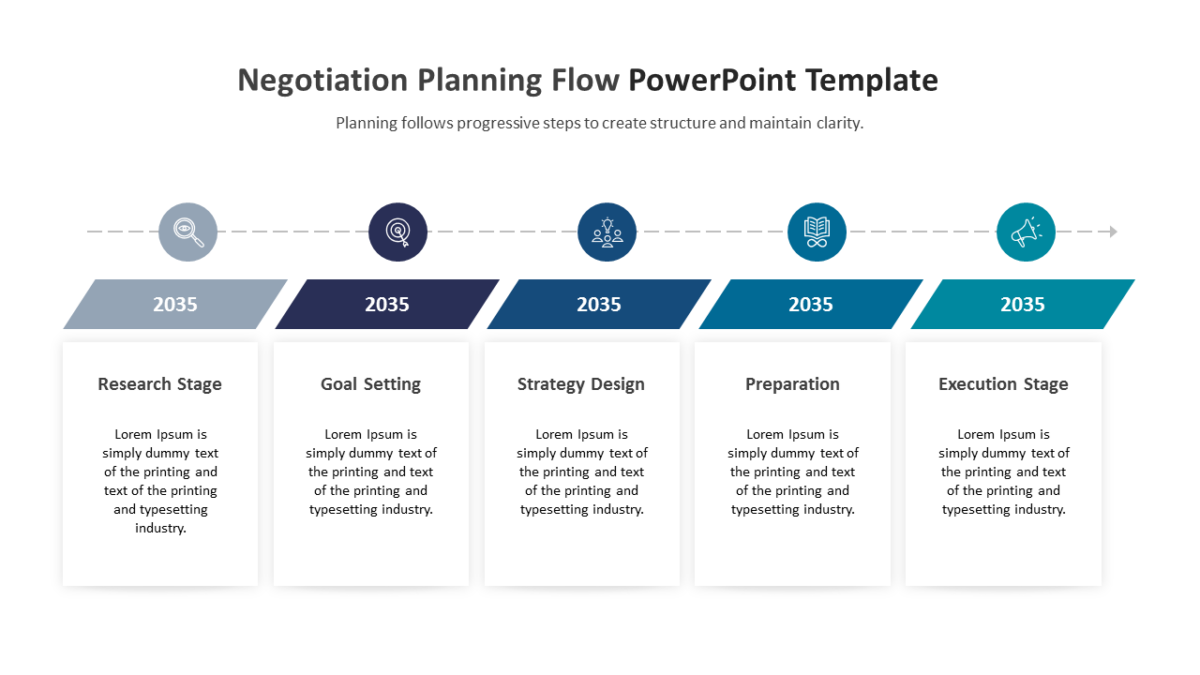
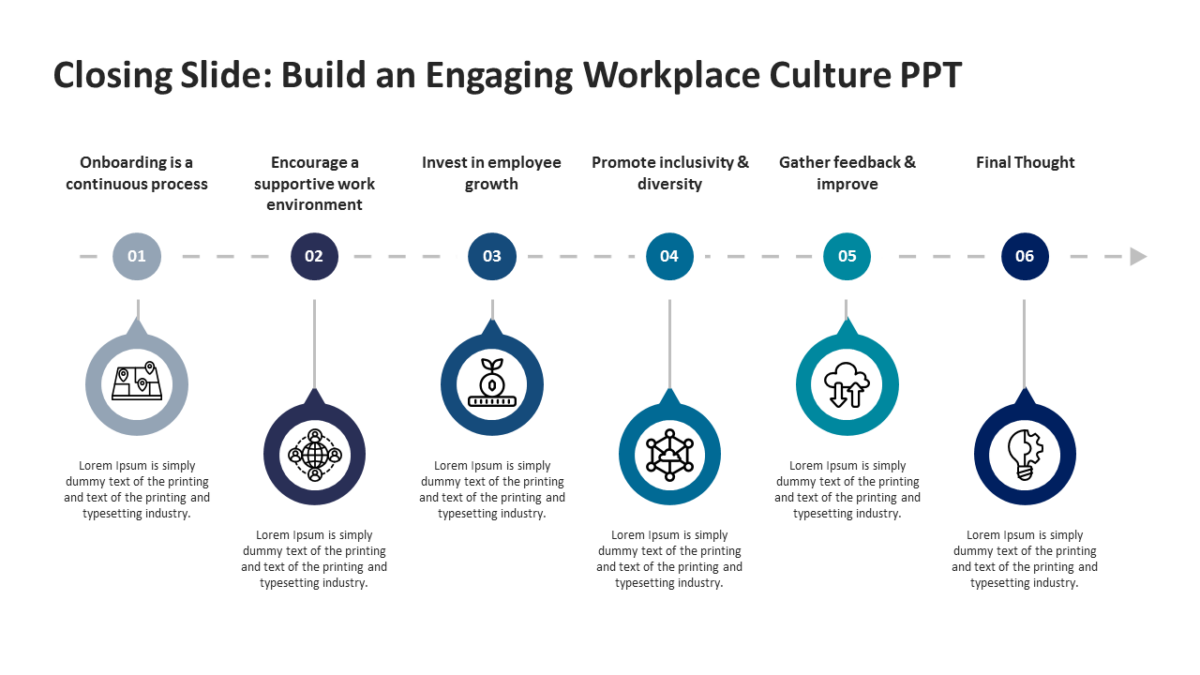
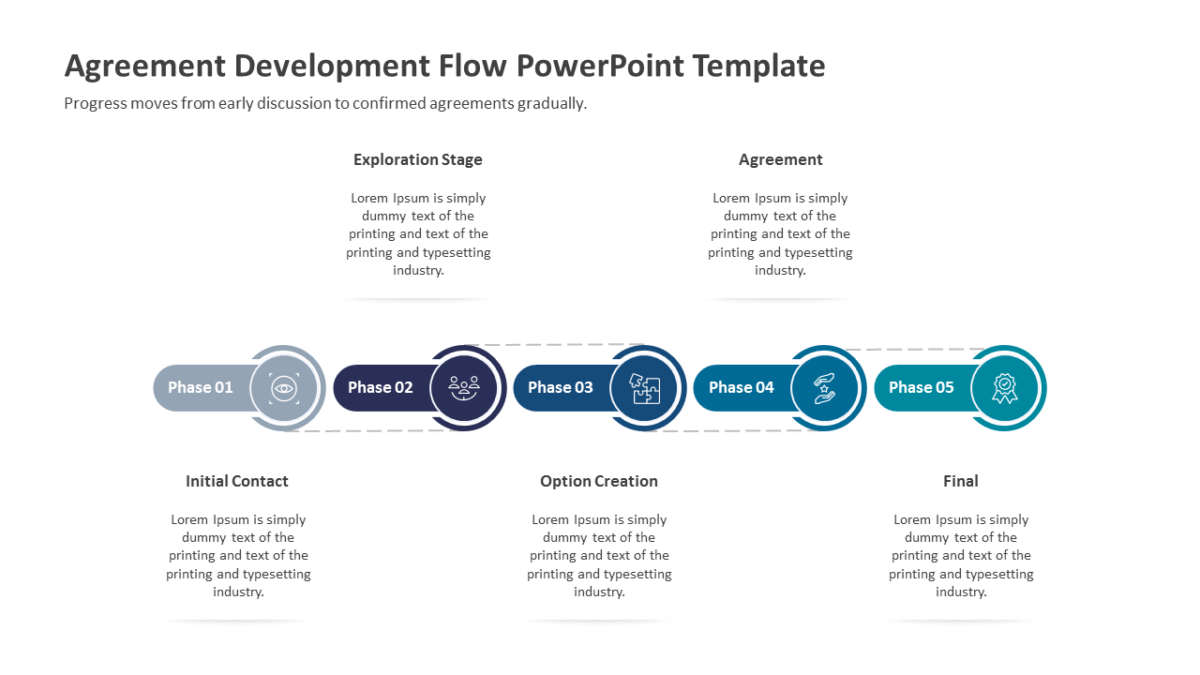
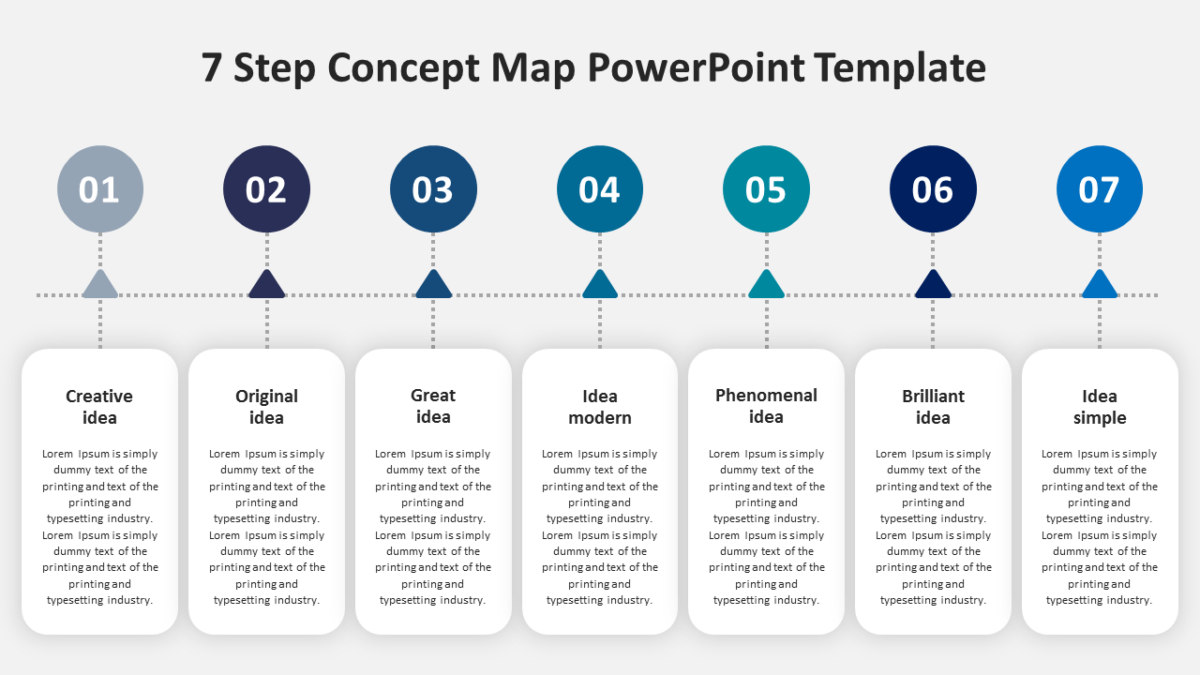
- A horizontal timeline axis with marked points
- Icon slots at each point on the track
- Date or period labels on every marker
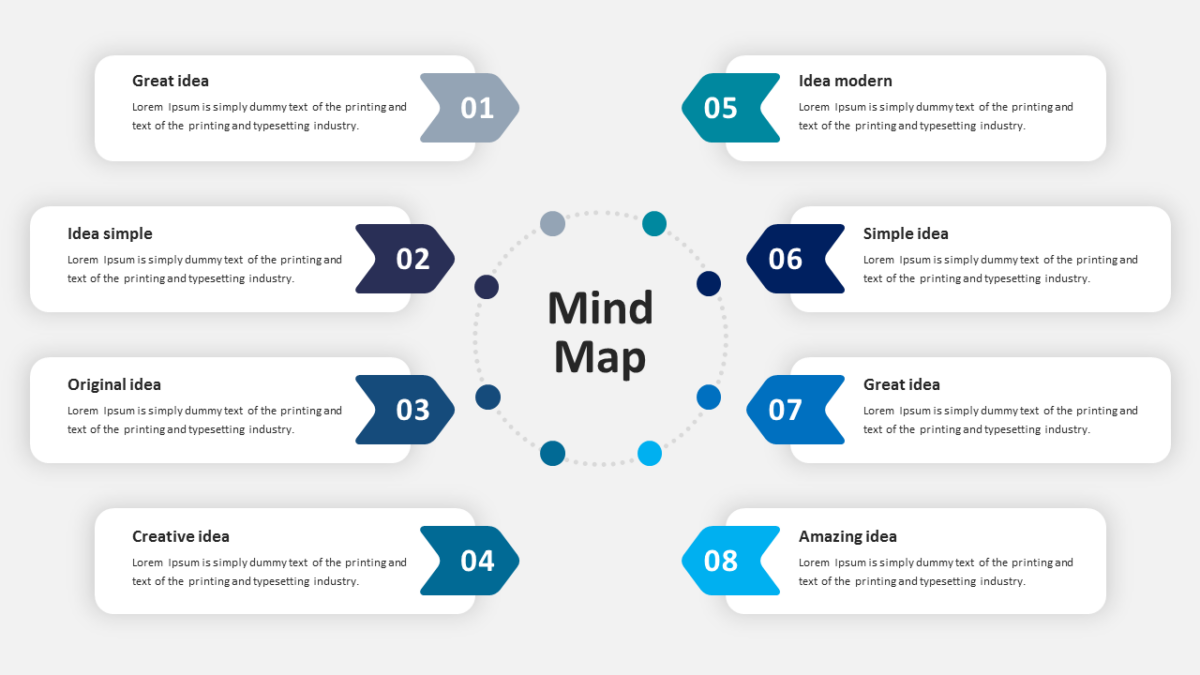
- A heading and note field per milestone
Fills, labels, icons and body copy are all editable. It ships at 16:9 and survives the trip into Google Slides or Keynote without breaking.
The usual audience is PMO teams, with delivery leads and scrum masters not far behind. Use it in the planning section, or as the delivery slide near the close. Browse the project management templates to compare a few layouts before committing.