Continuous Improvement Loop PowerPoint Infographic
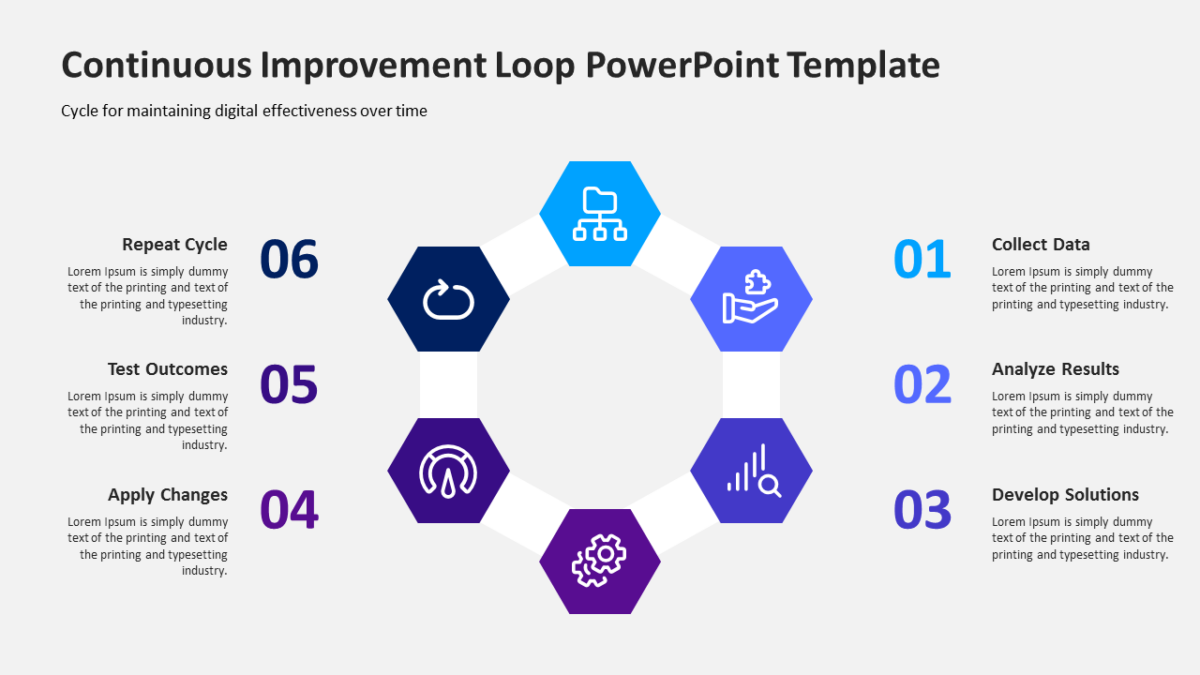
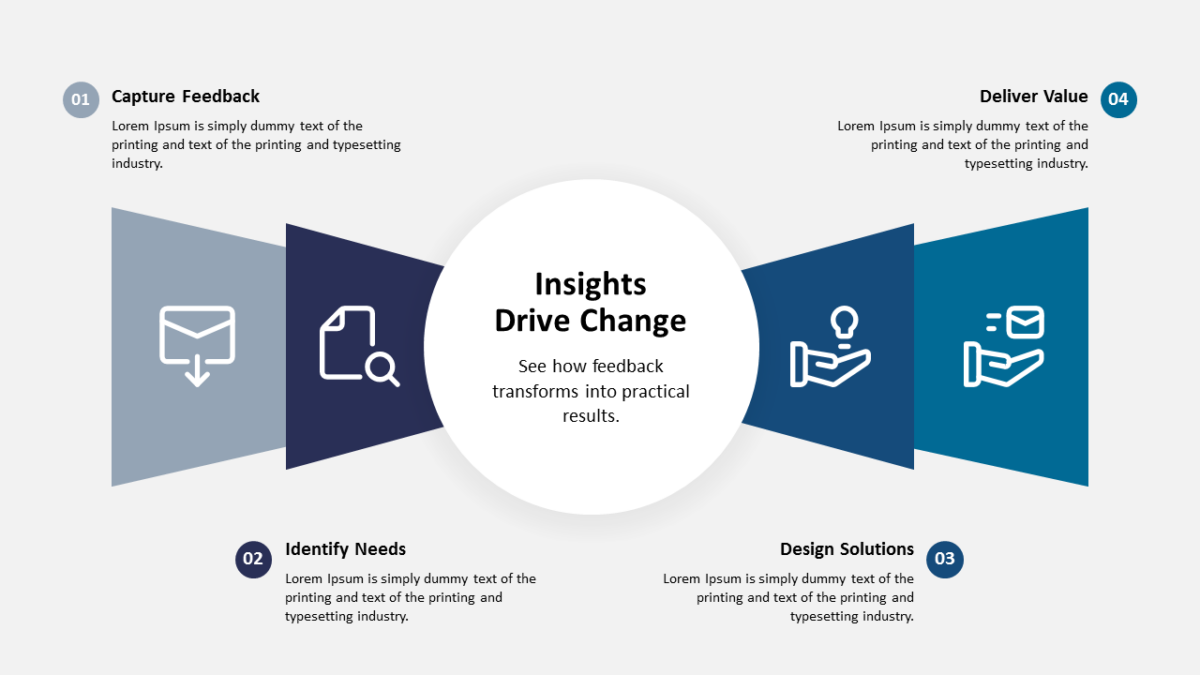
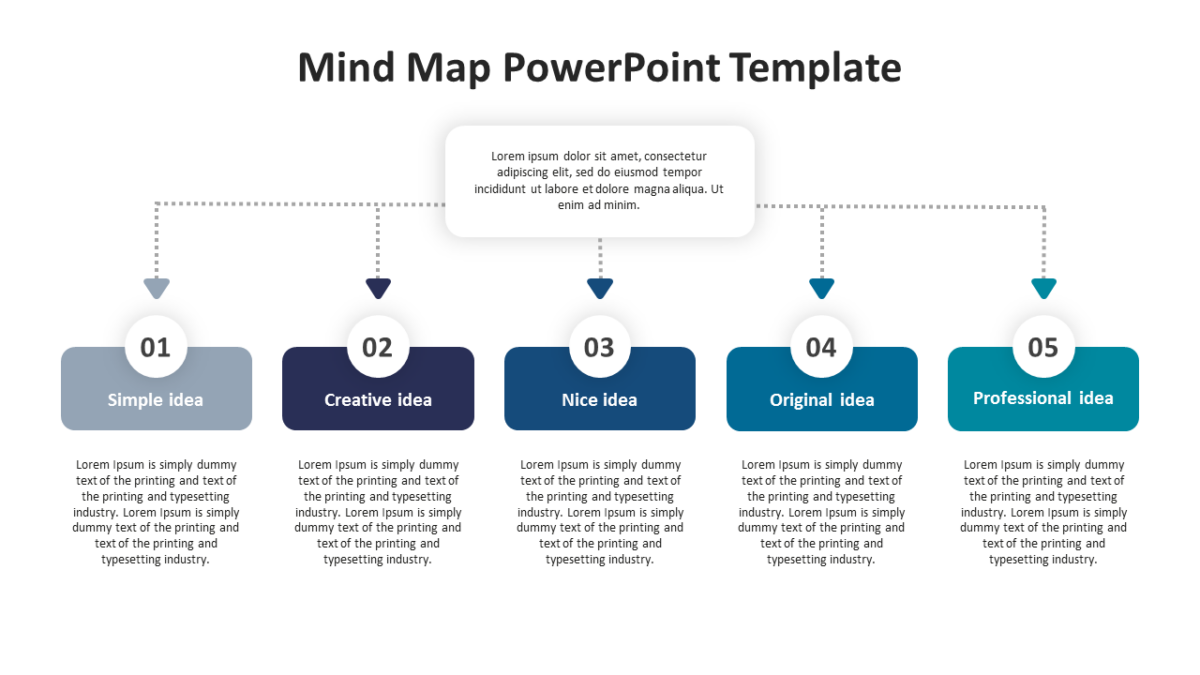
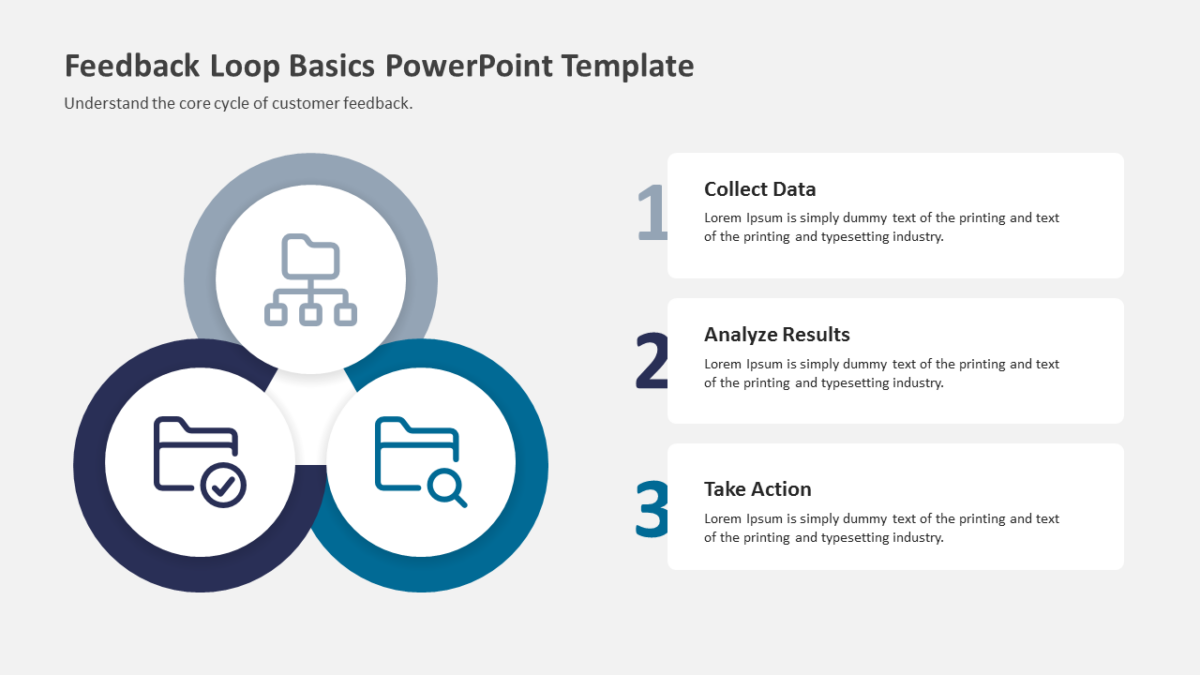
The Continuous Improvement Loop PowerPoint Infographic draws a loop, which is the honest shape for anything that repeats.
Strategy decks fail when the logic is sound but invisible. Making the structure explicit is what lets a room challenge the thinking instead of the wording.
What’s on the slide
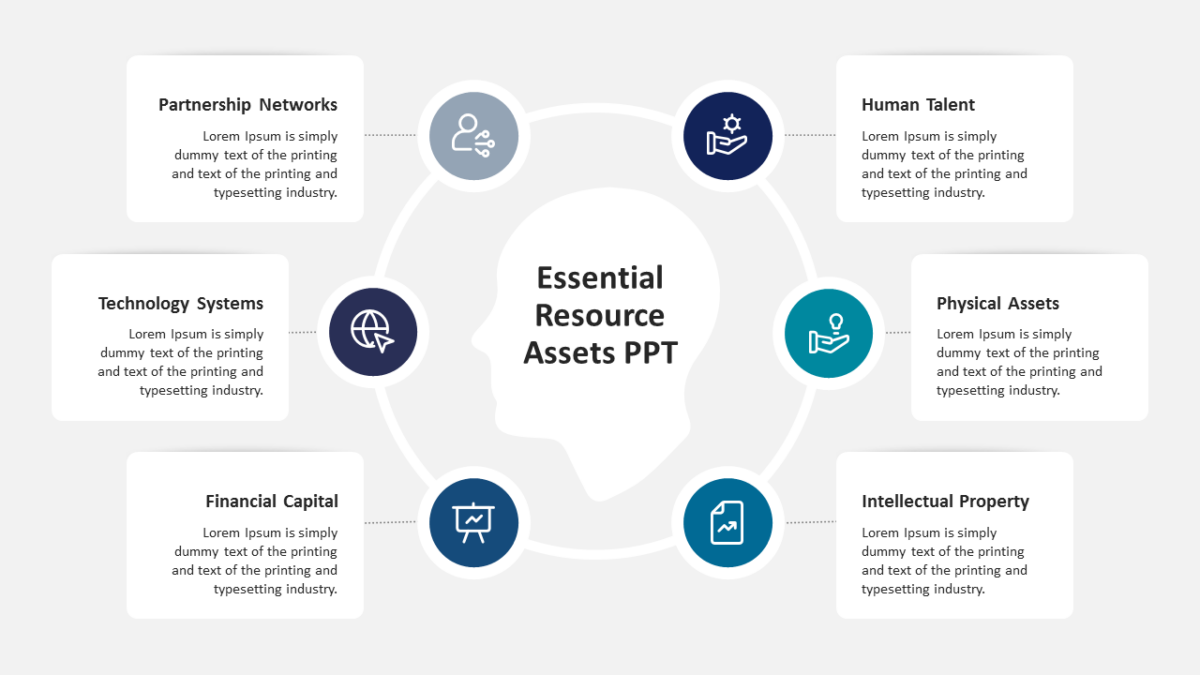
- A ring divided into 6 segments
- Open space at the center for a title or summary
- An icon and text block for every stage
- Directional arrows carrying the eye around the loop
- Distinct fill per segment for quick reference
Drop in your own copy, swap the palette, resize what you need. Everything is a vector shape. 16:9, and Google Slides and Keynote handle it without issue.
Corporate development will use it most often. So will founders, and it holds up for executives too. Place it mid-deck, as the how-it-works slide. For a different treatment of the same idea, the rest of the workflow templates are worth a look.