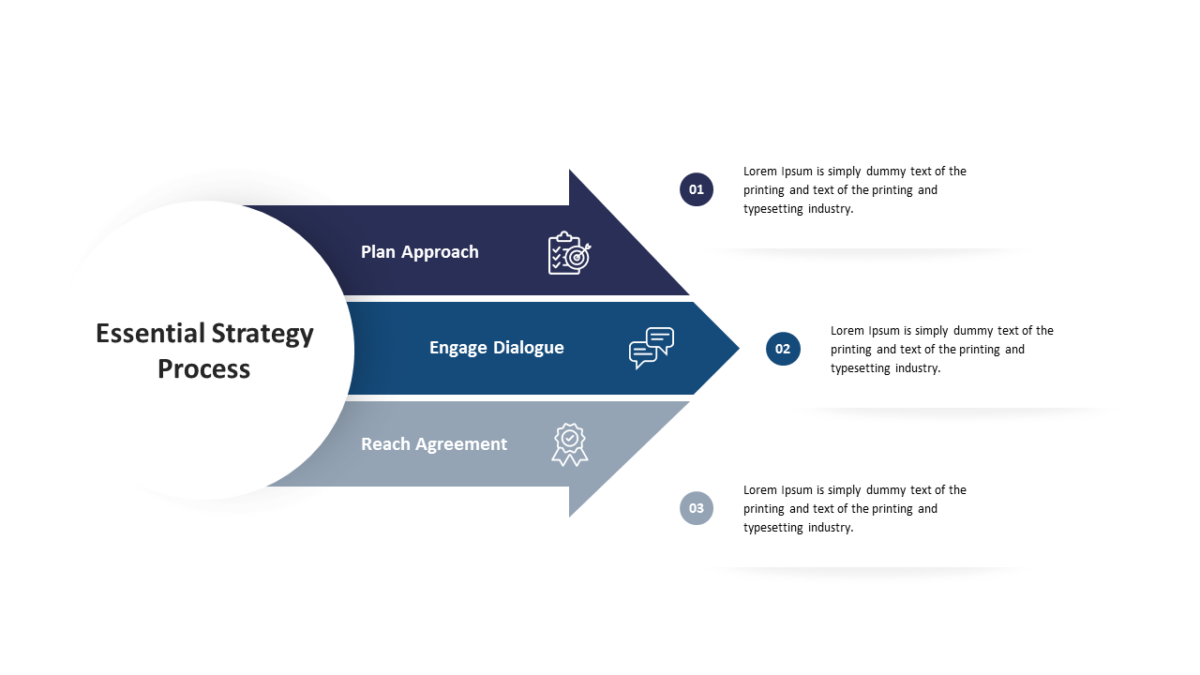
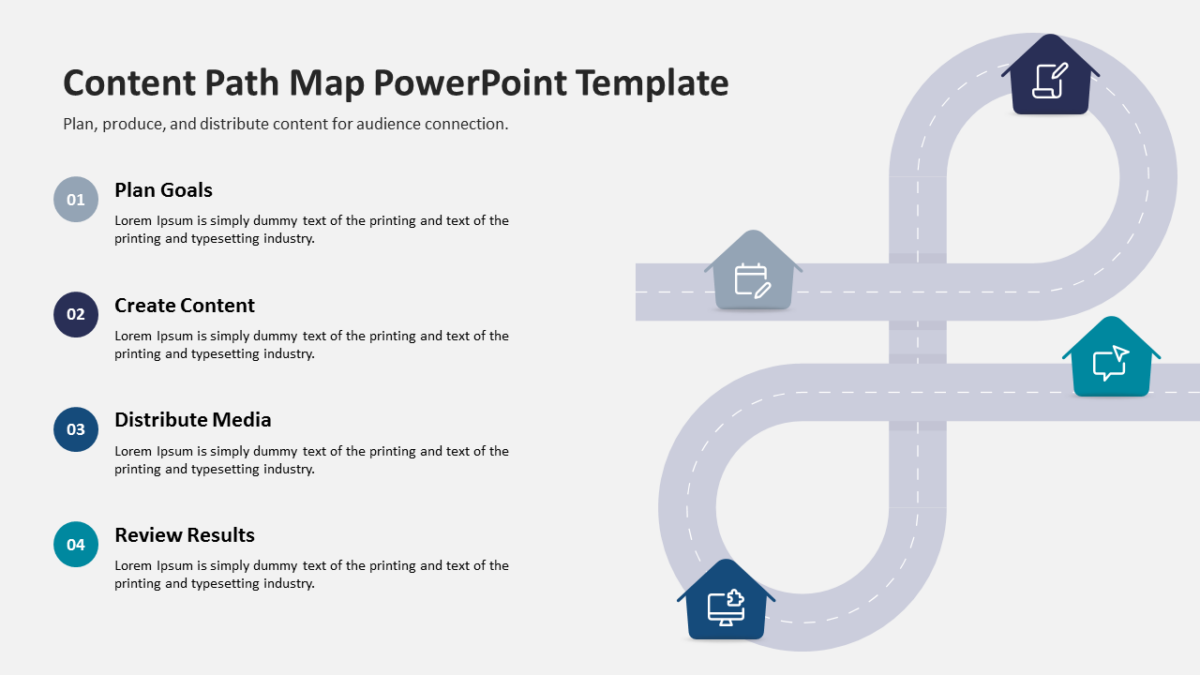
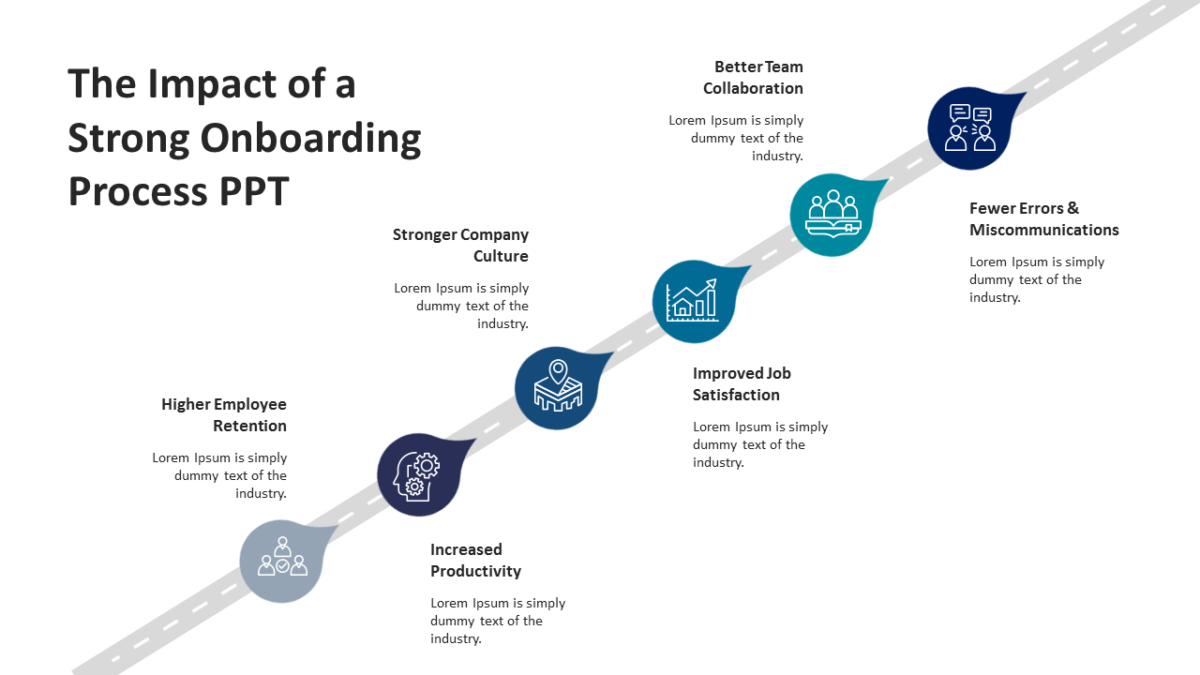
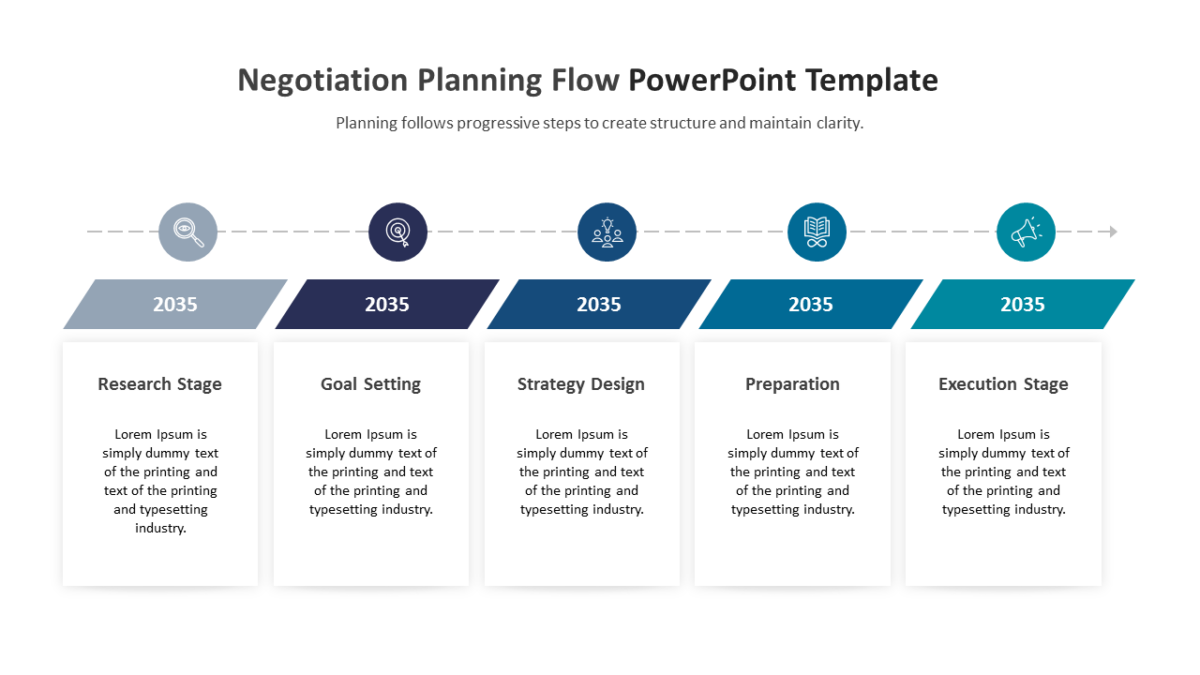
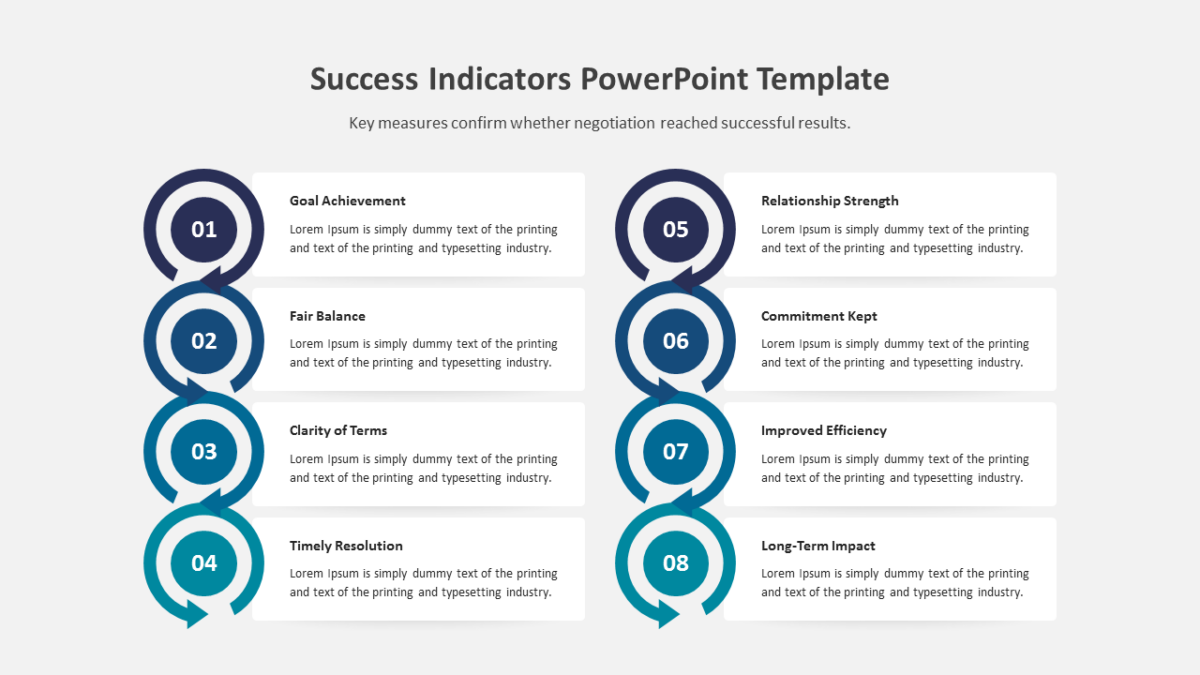
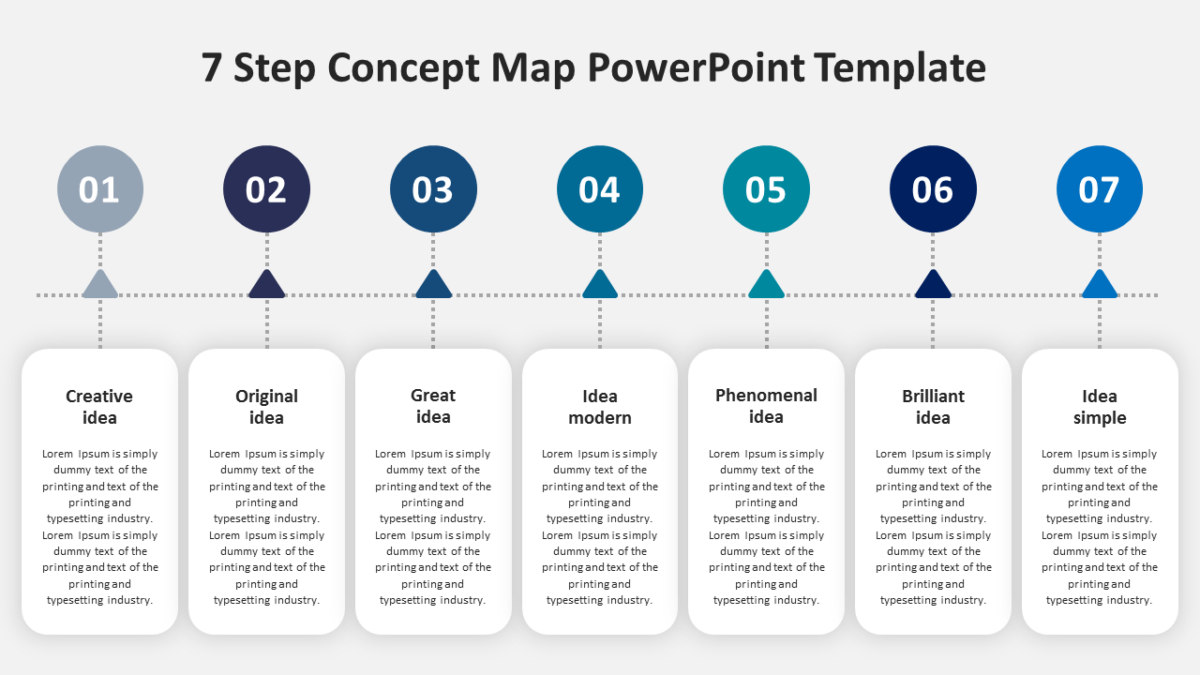
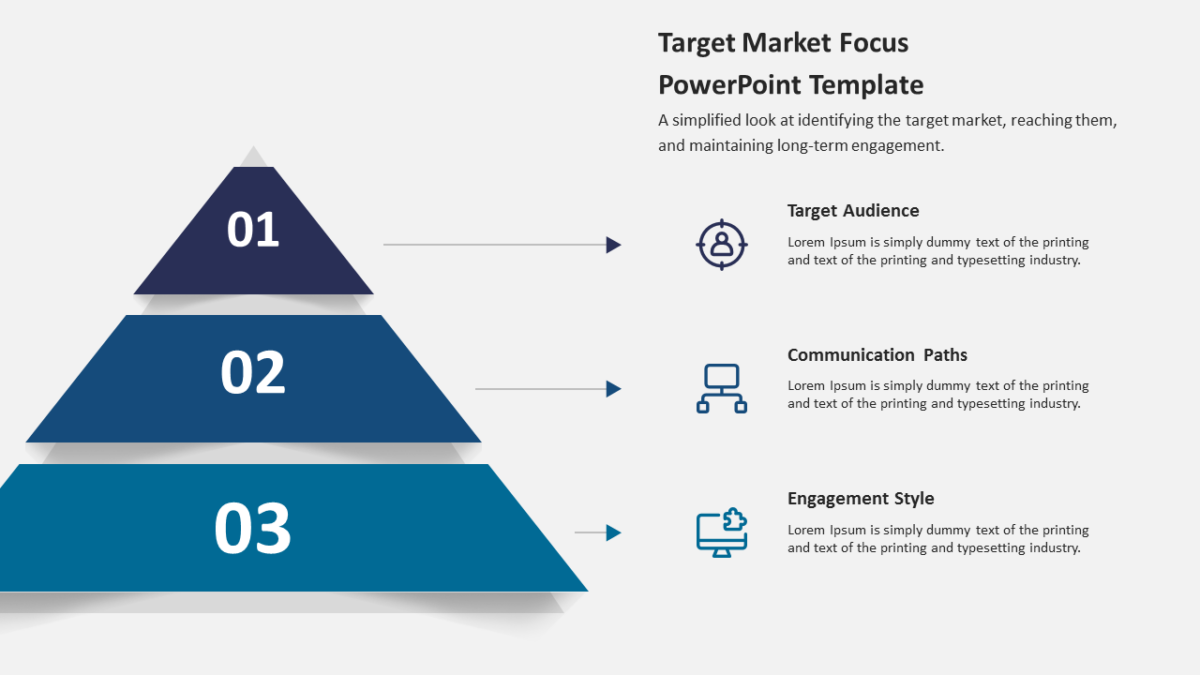
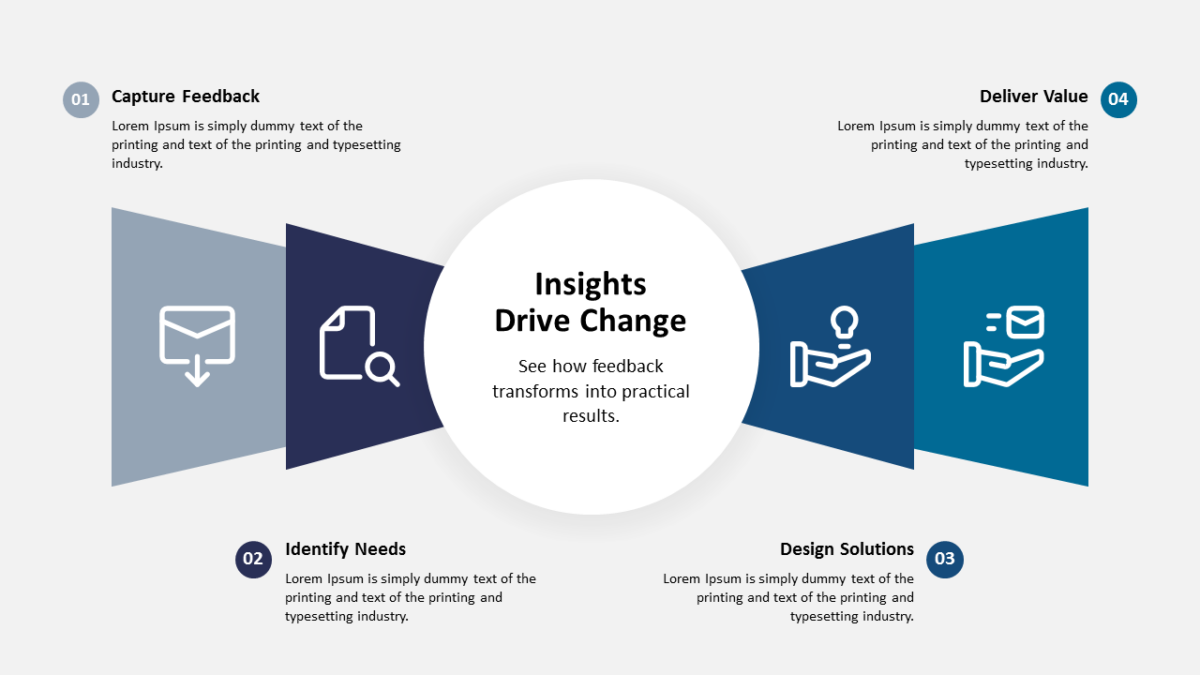
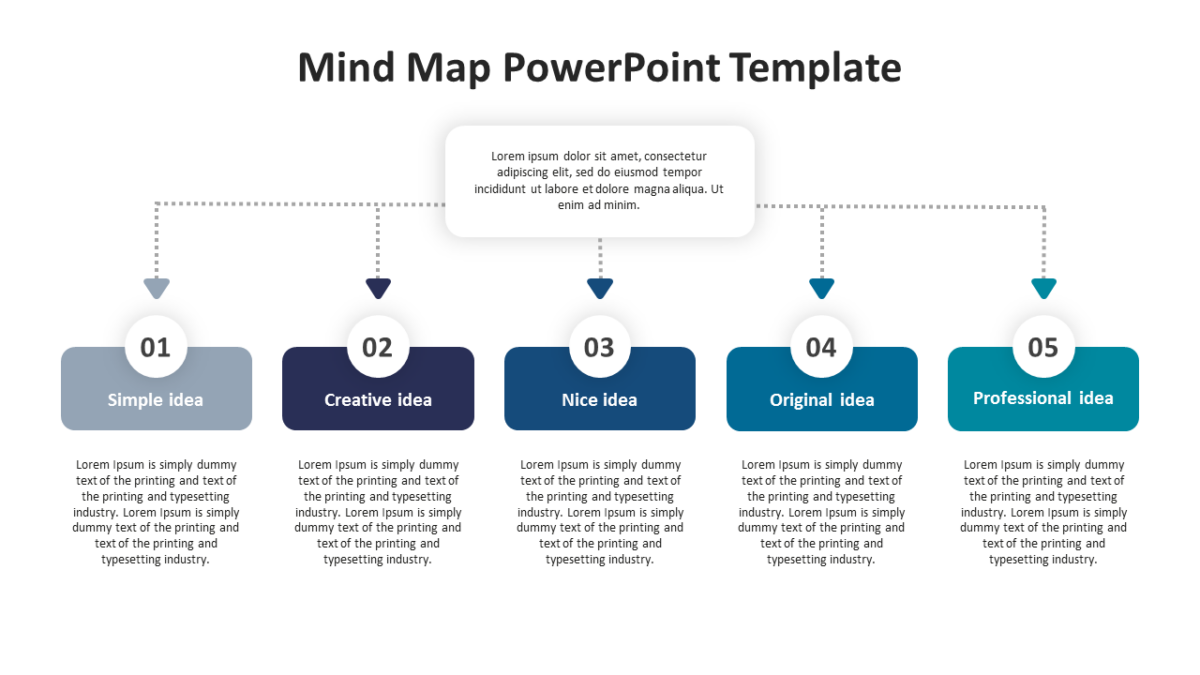
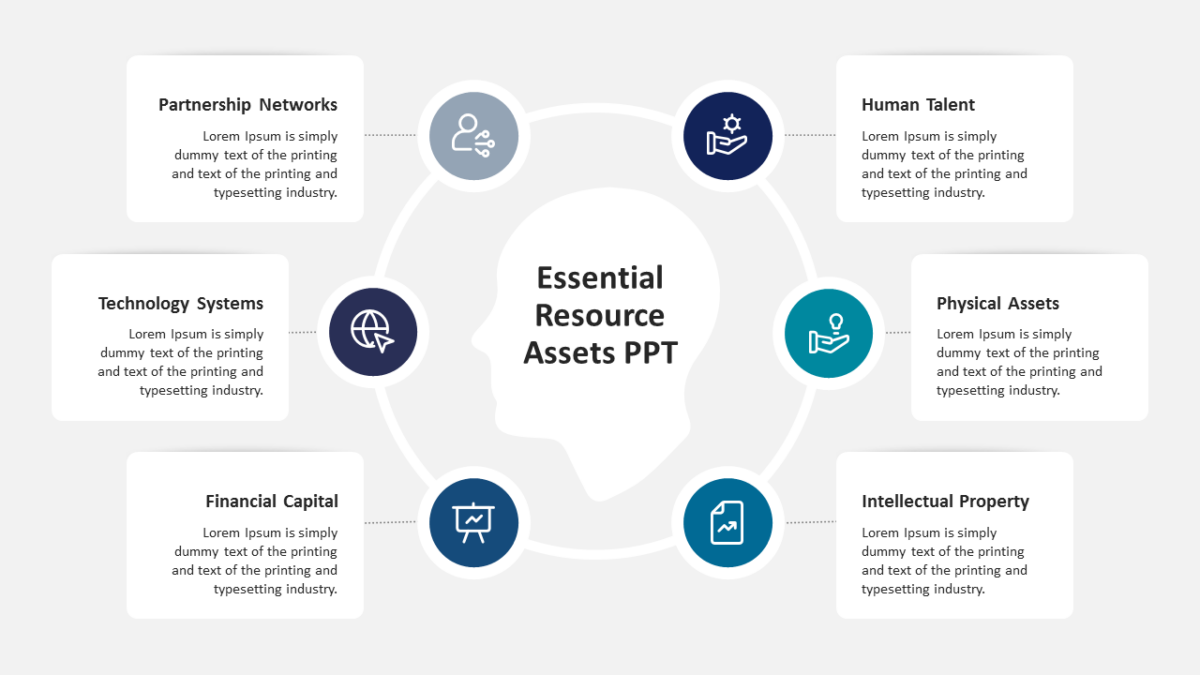
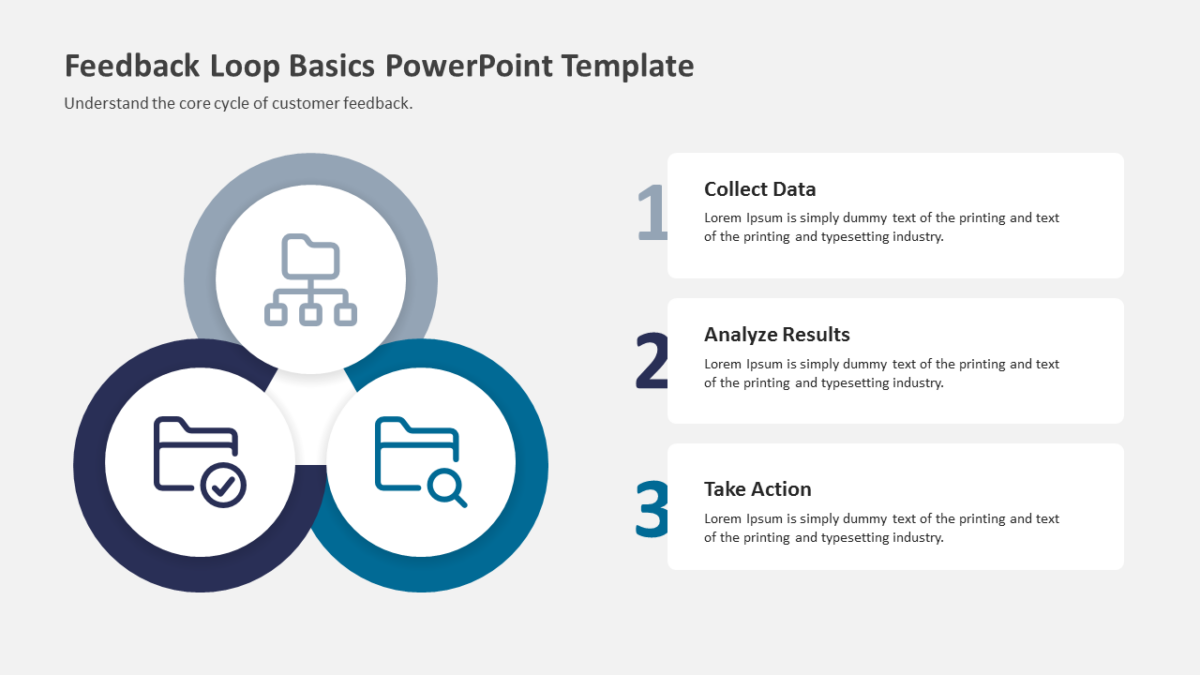
Continuous Risk Management Cycle PowerPoint Infographic
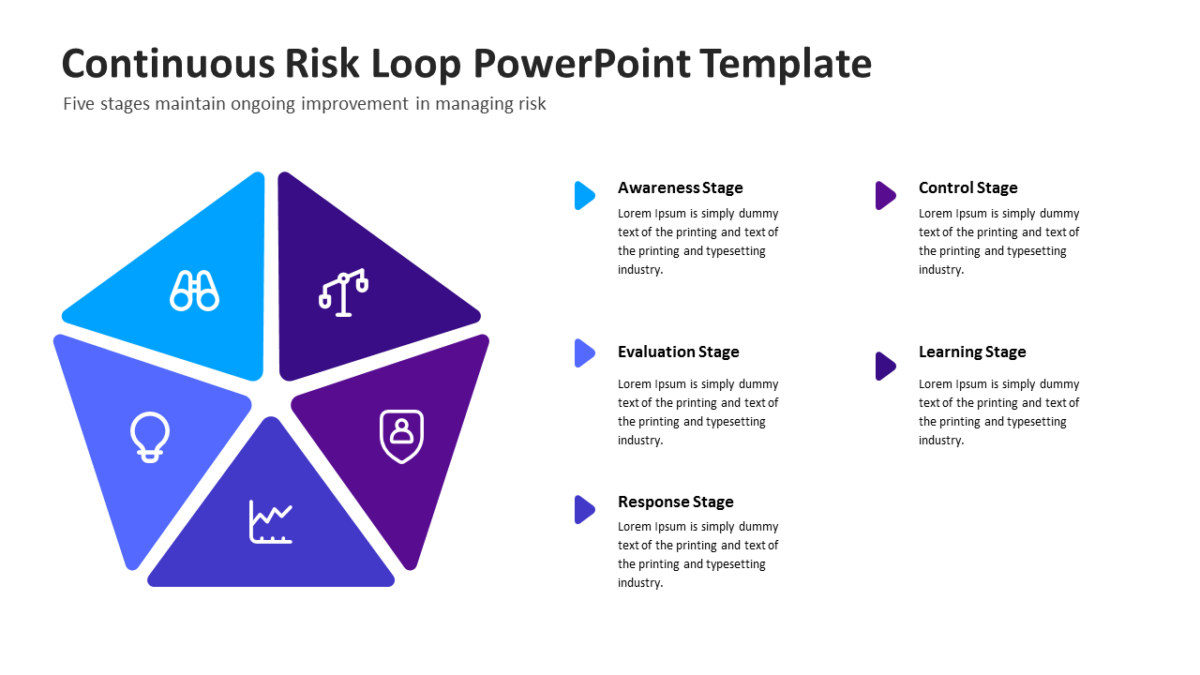
Drawing a recurring process flat misrepresents it. The Continuous Risk Management Cycle PowerPoint Infographic does not make that mistake.
Boards want exposure summarised, not enumerated. A structured visual gives them the shape of the risk without burying it in a register.
What’s on the slide
- A ring divided into segments
- Open space at the center for a title or summary
- An icon and text block for every stage
- Distinct fill per segment for quick reference
- Directional arrows carrying the eye around the loop
Drop in your own copy, swap the palette, resize what you need. Everything is a vector shape. 16:9, and Google Slides and Keynote handle it without issue.
Built with legal operations in mind, but governance teams and internal auditors put it to work just as often. Place it mid-deck, as the how-it-works slide. There is more in the same vein across the workflow templates.