Digital Adoption Cycle PowerPoint Infographic
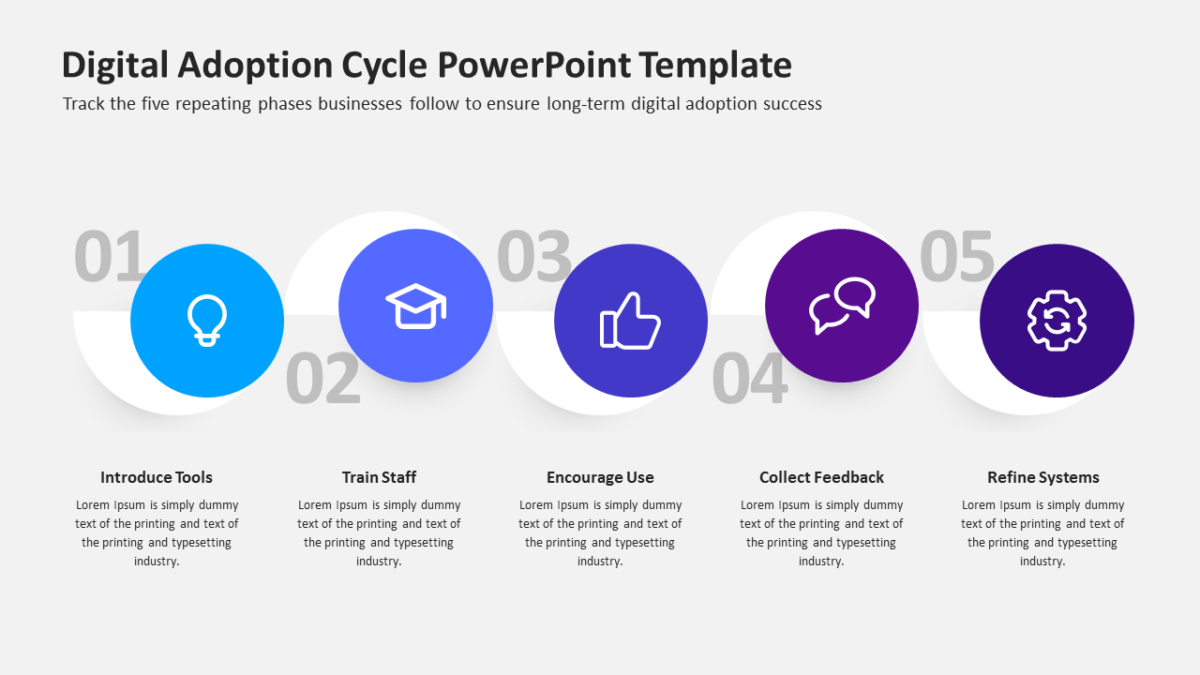
The Digital Adoption Cycle PowerPoint Infographic draws a loop, which is the honest shape for anything that repeats.
Executive audiences decide fast and read little. A single well-built visual carries more of the argument than three slides of supporting prose.
What’s on the slide
- A ring divided into segments
- Directional arrows carrying the eye around the loop
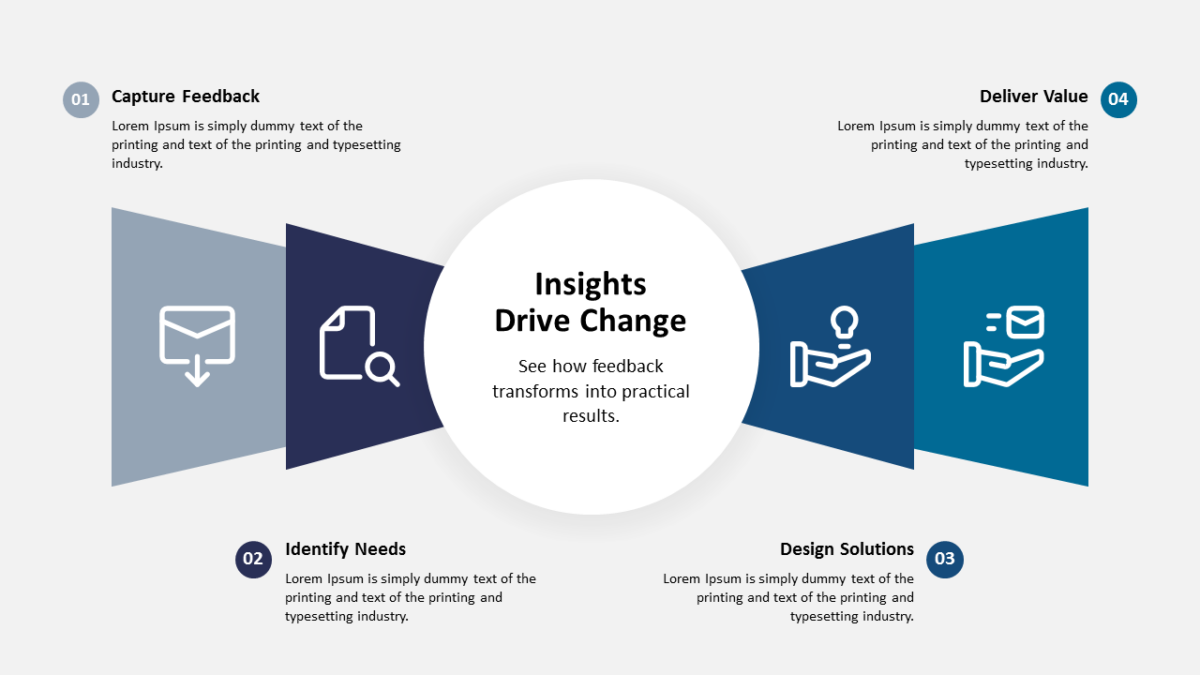
- Open space at the center for a title or summary
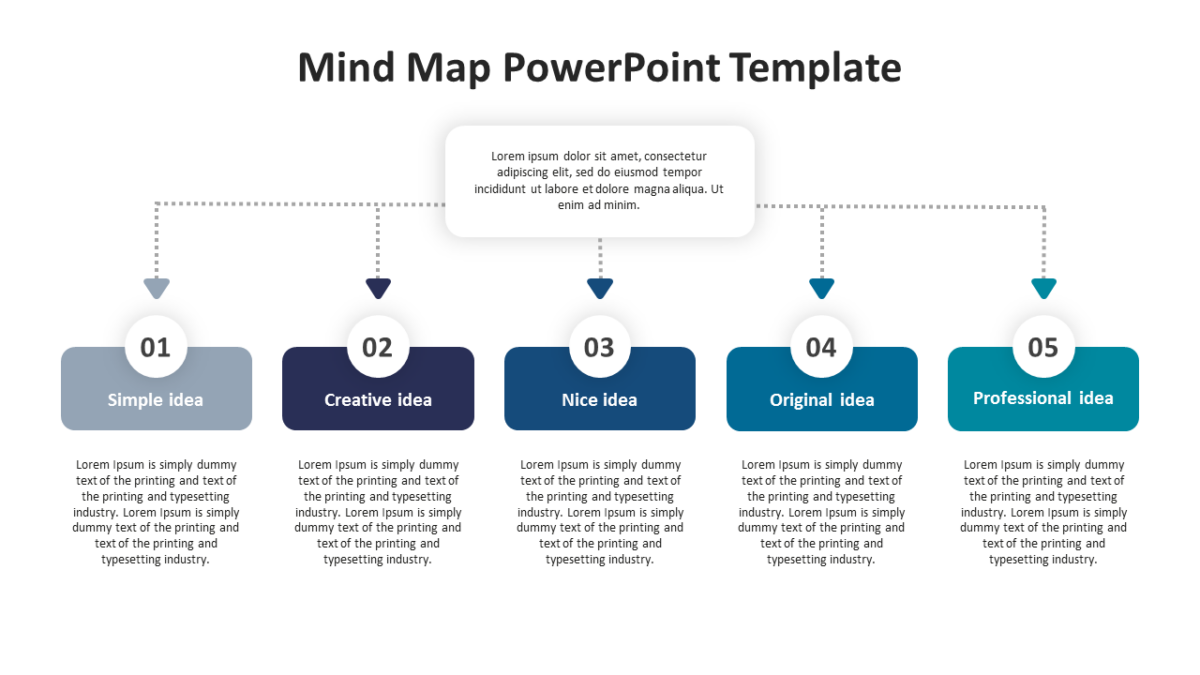
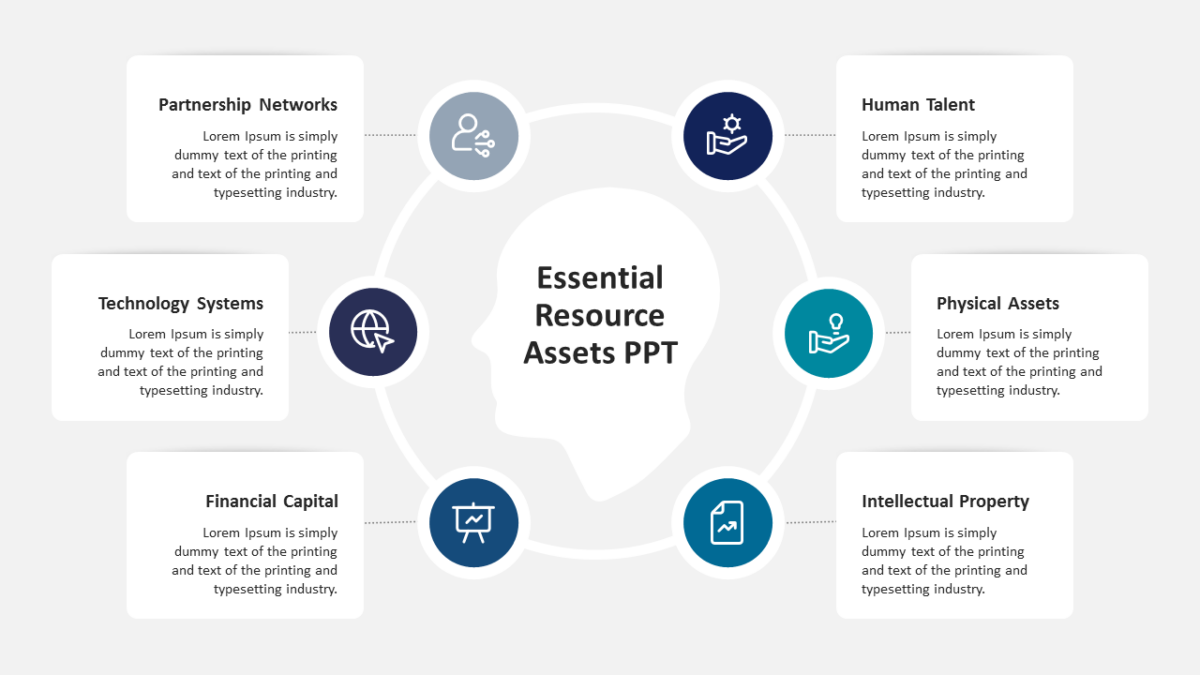
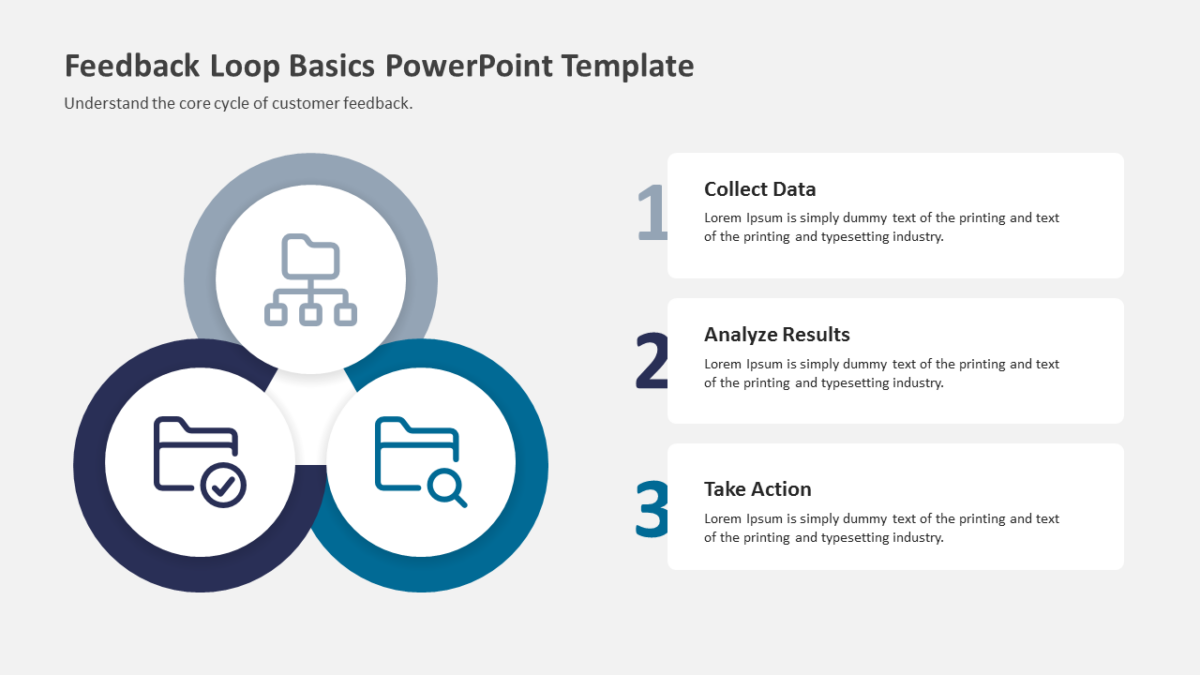
- An icon and text block for every stage
- Distinct fill per segment for quick reference
Every element is a native PowerPoint shape, so colors, icons and copy are all yours to change. Sized 16:9, and it opens cleanly in Google Slides and Keynote.
It lands with executives first, then corporate development, and strategy leads run into the same problem often enough to want it. Use it when someone asks how the thing sustains itself. The other business templates handle the same job at different scales.