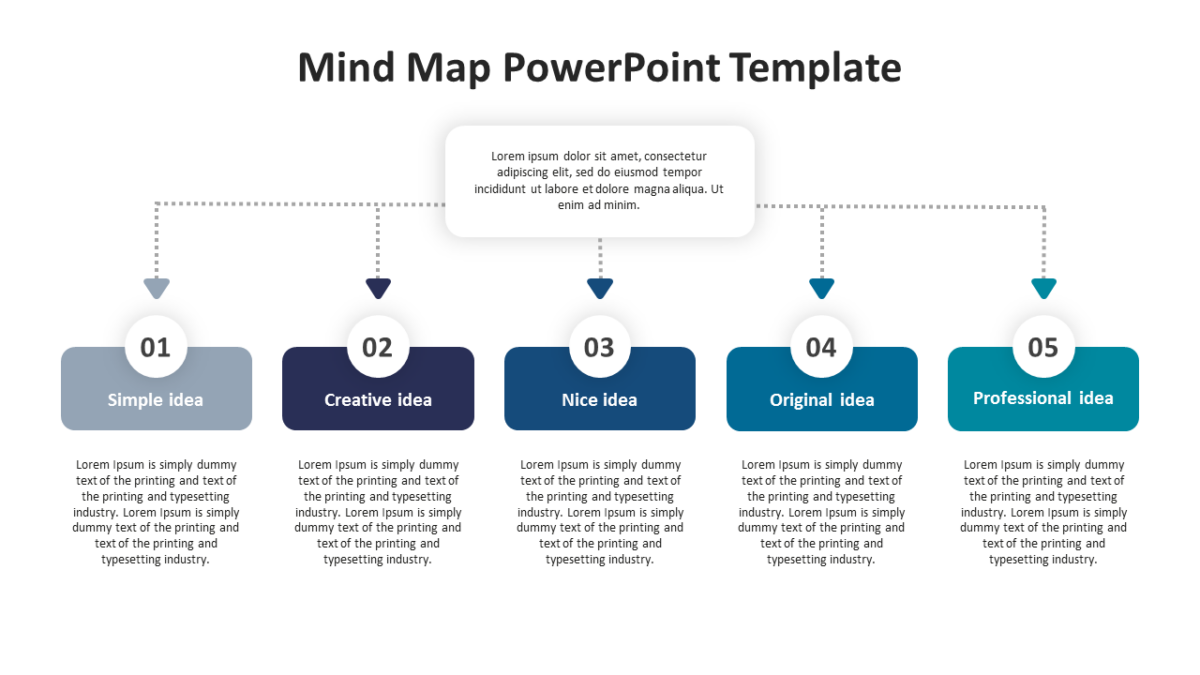
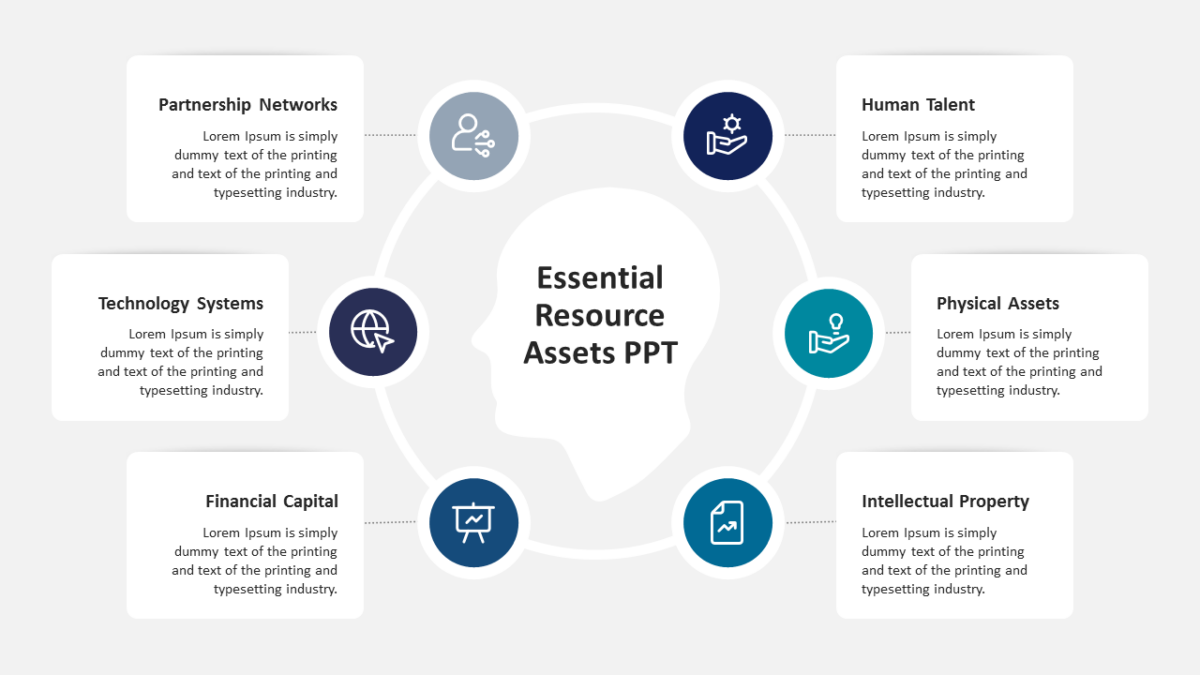
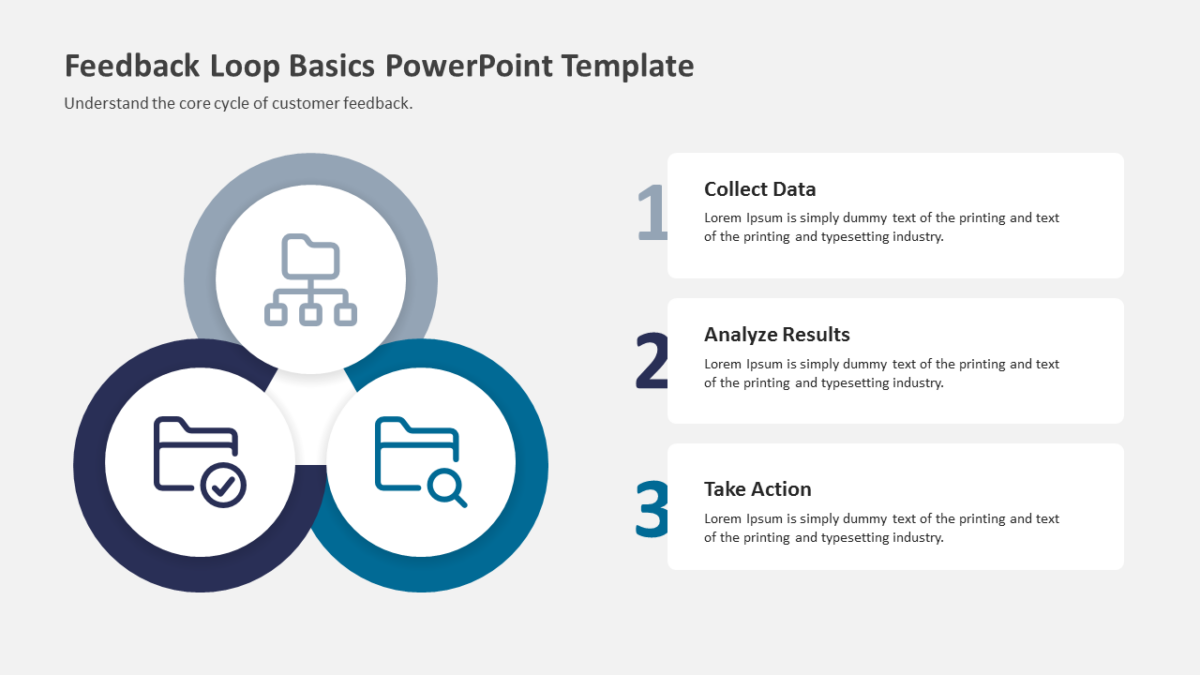
Investment Planning PowerPoint Infographic
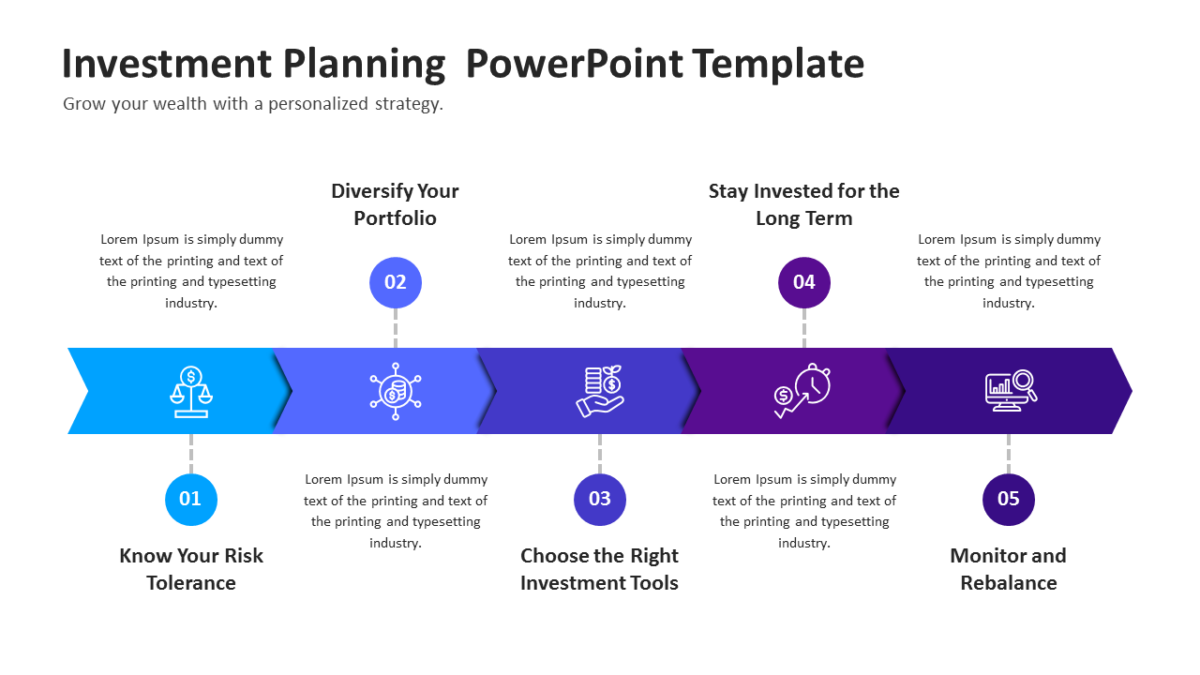
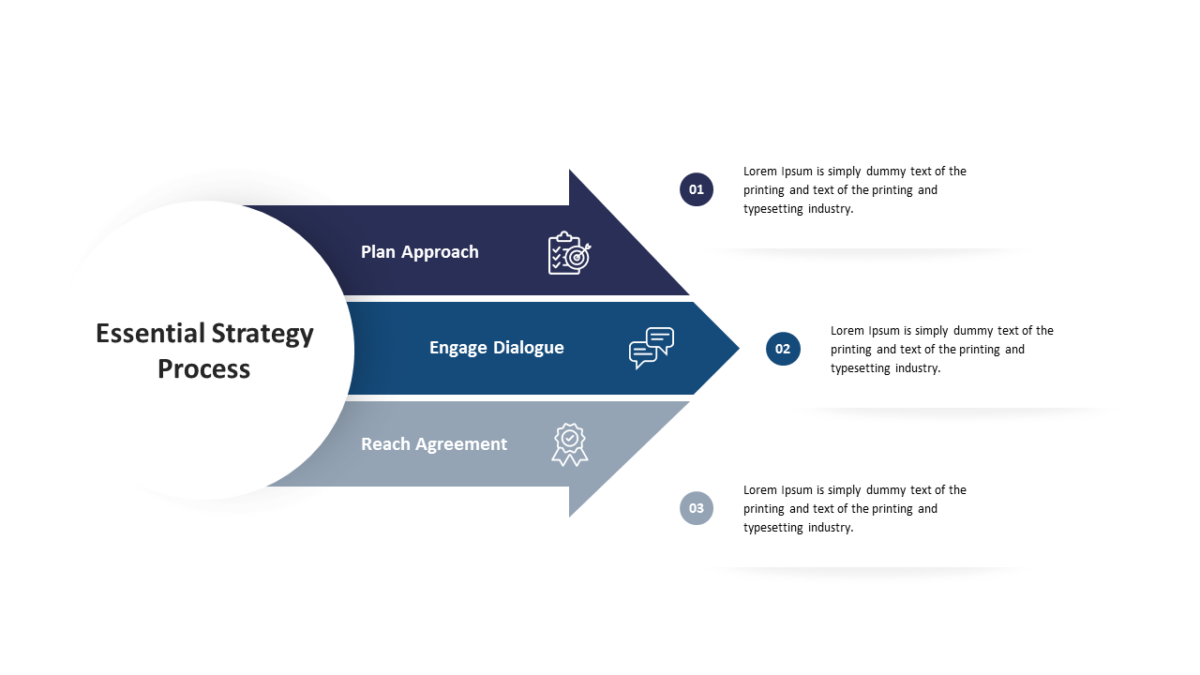
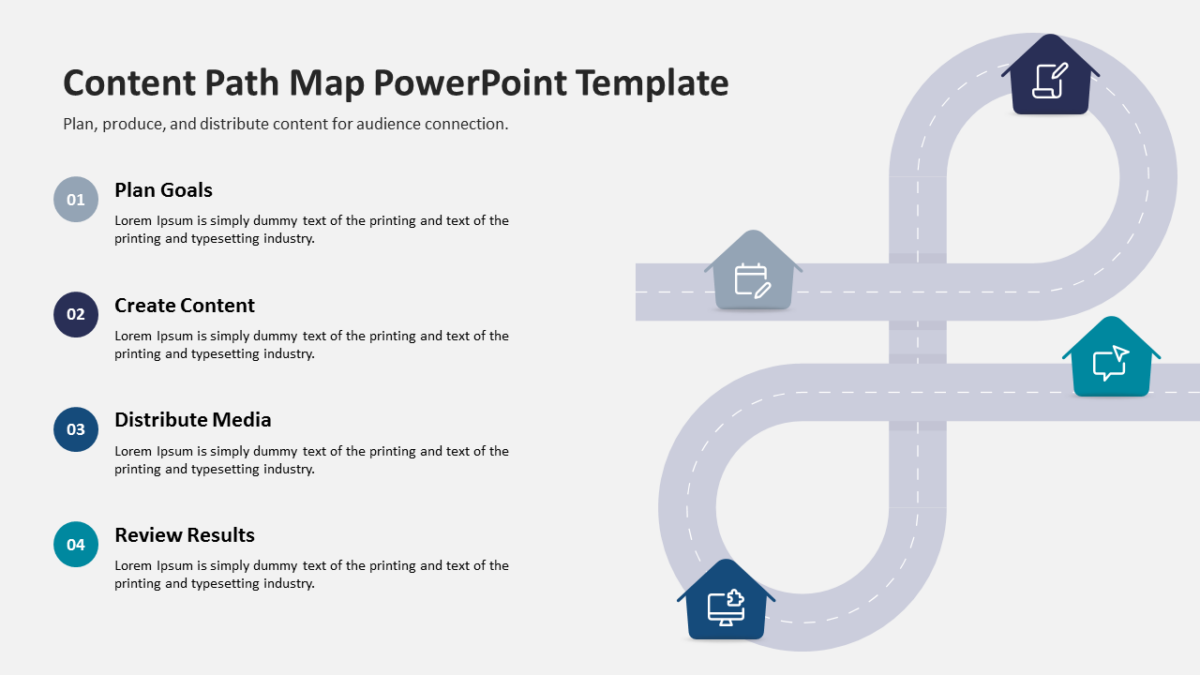
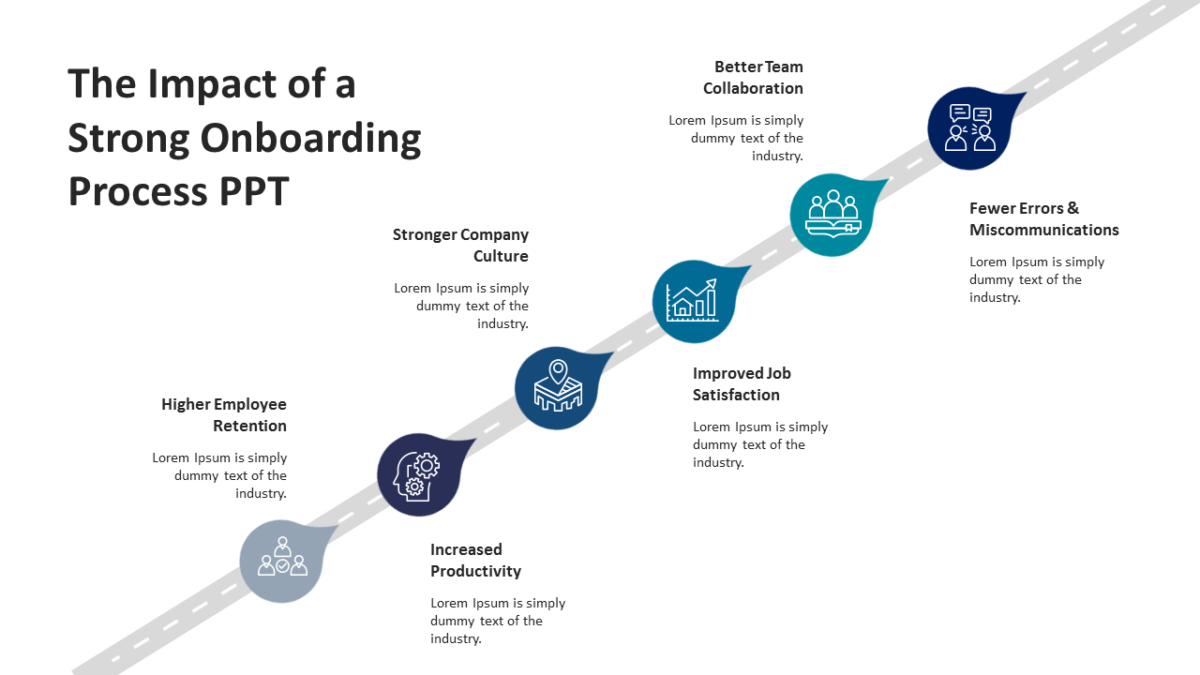
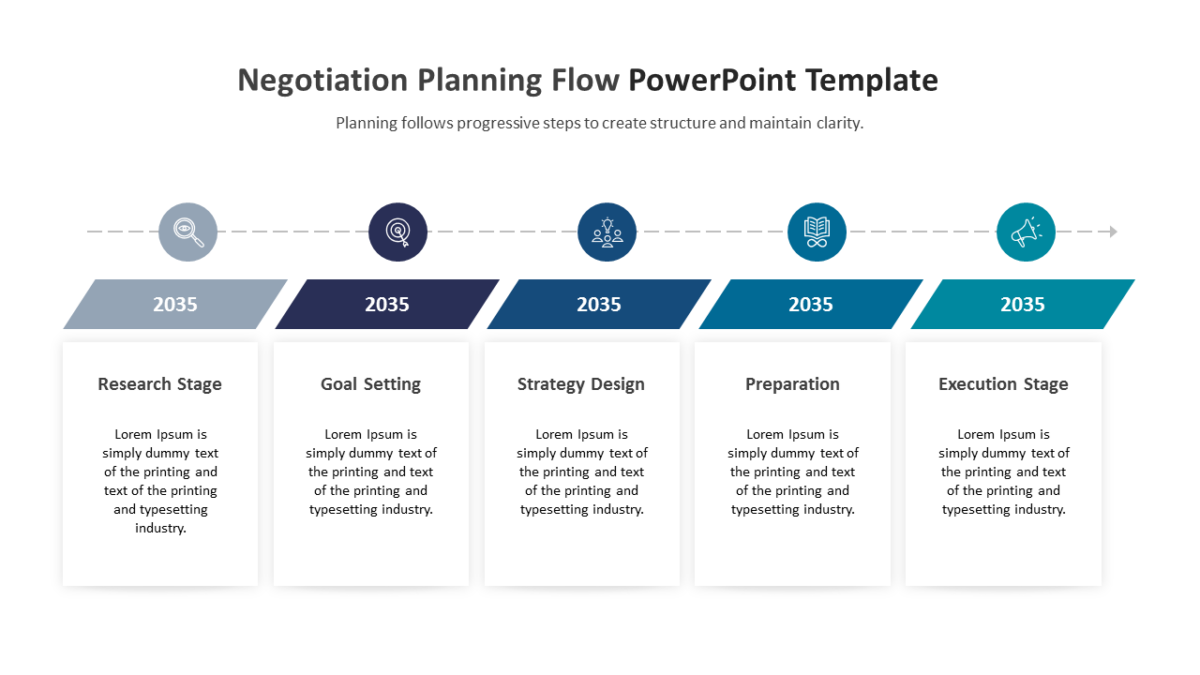
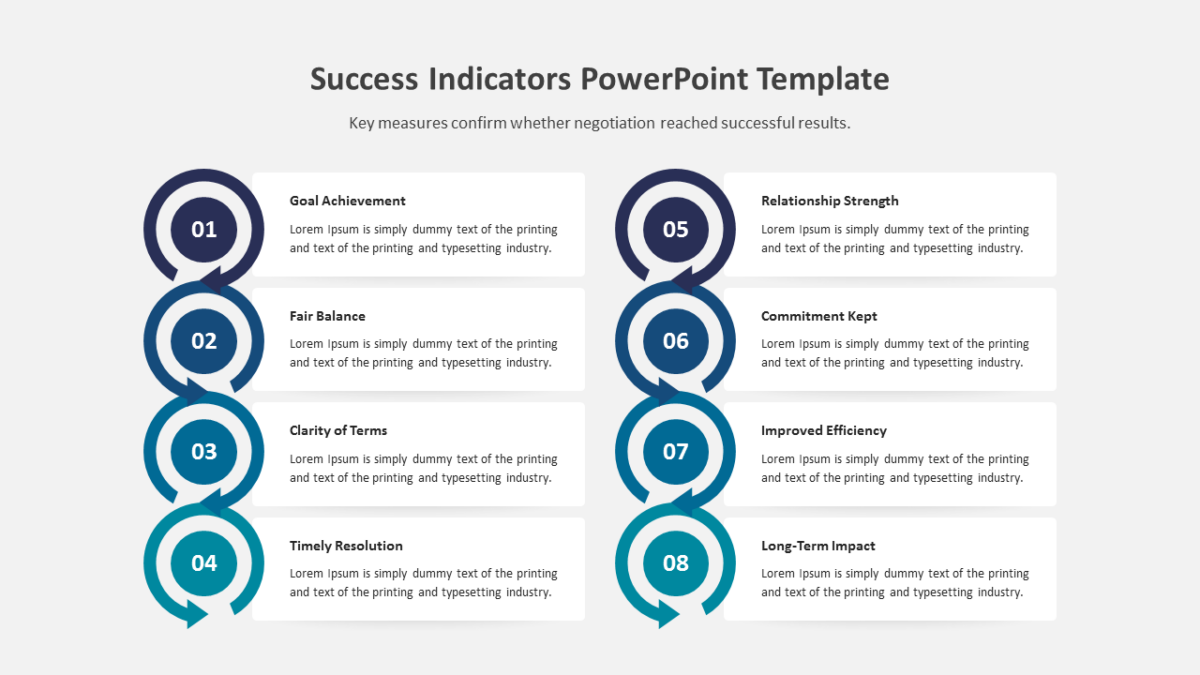
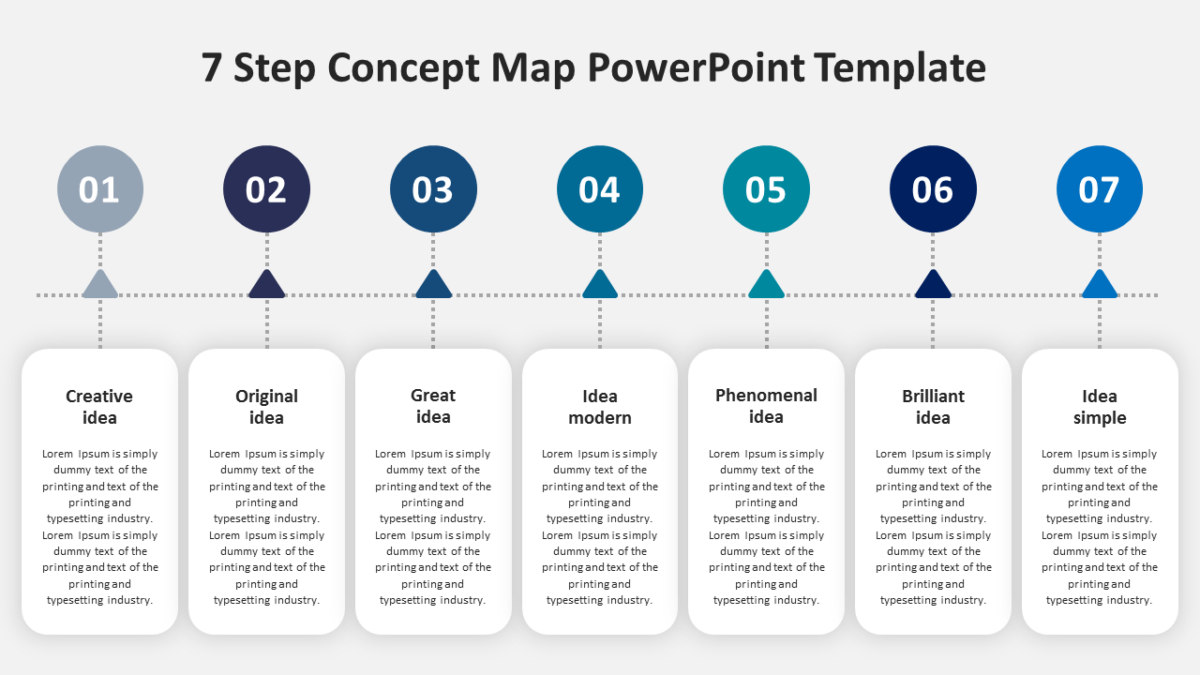
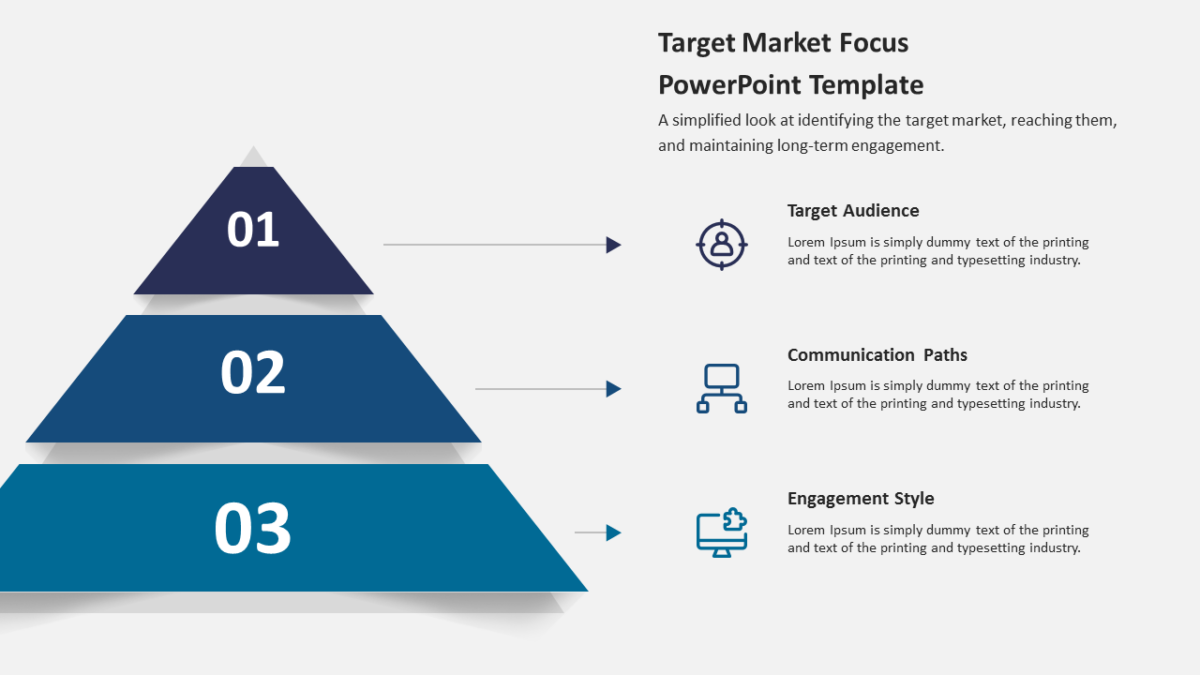
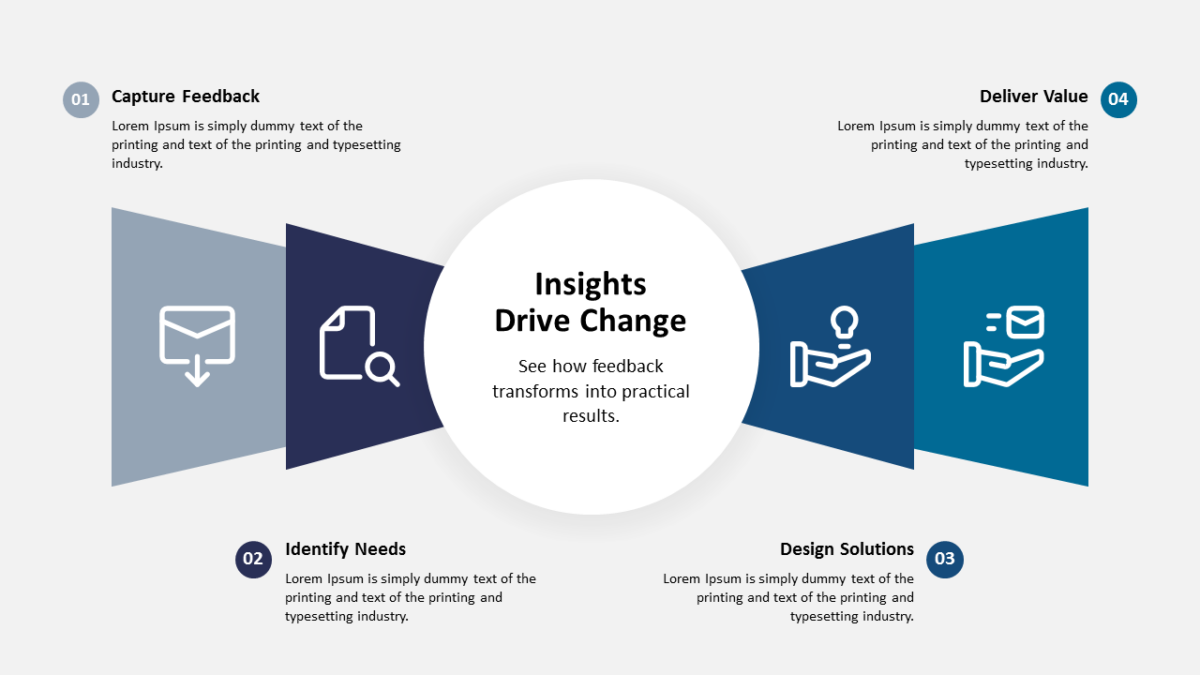
Everything on the Investment Planning PowerPoint Infographic is arranged to be read in one pass.
The point of a finance slide is not to show every figure. It is to show the shape of the figures clearly enough that questions get specific.
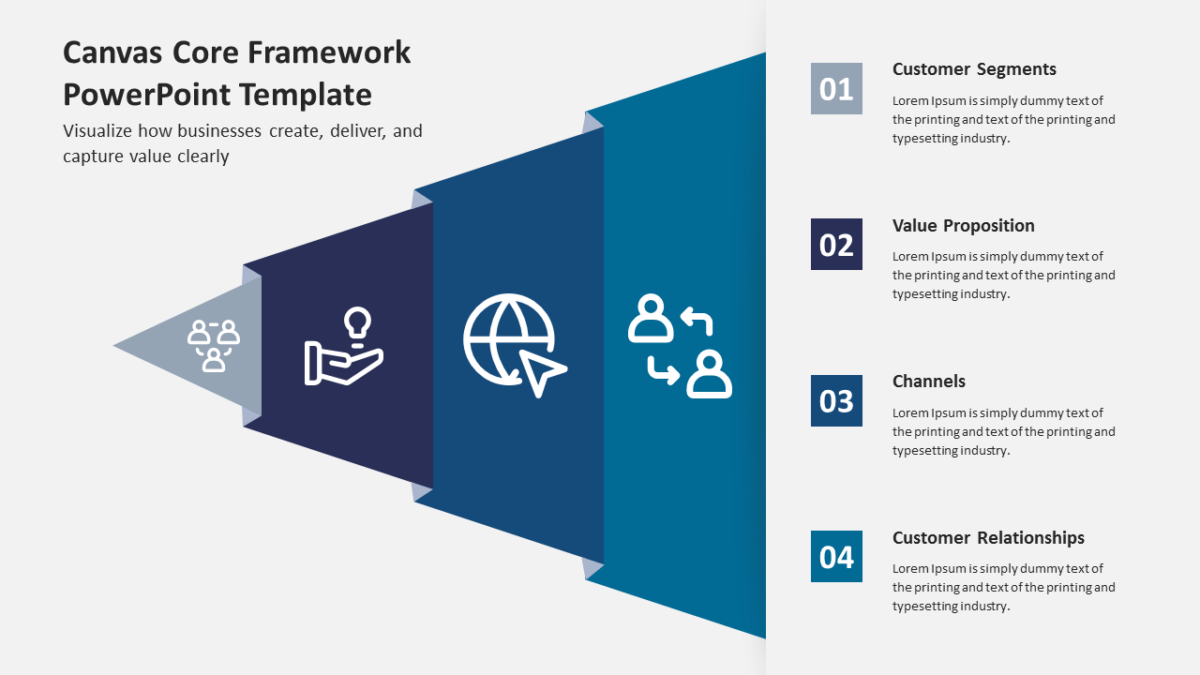
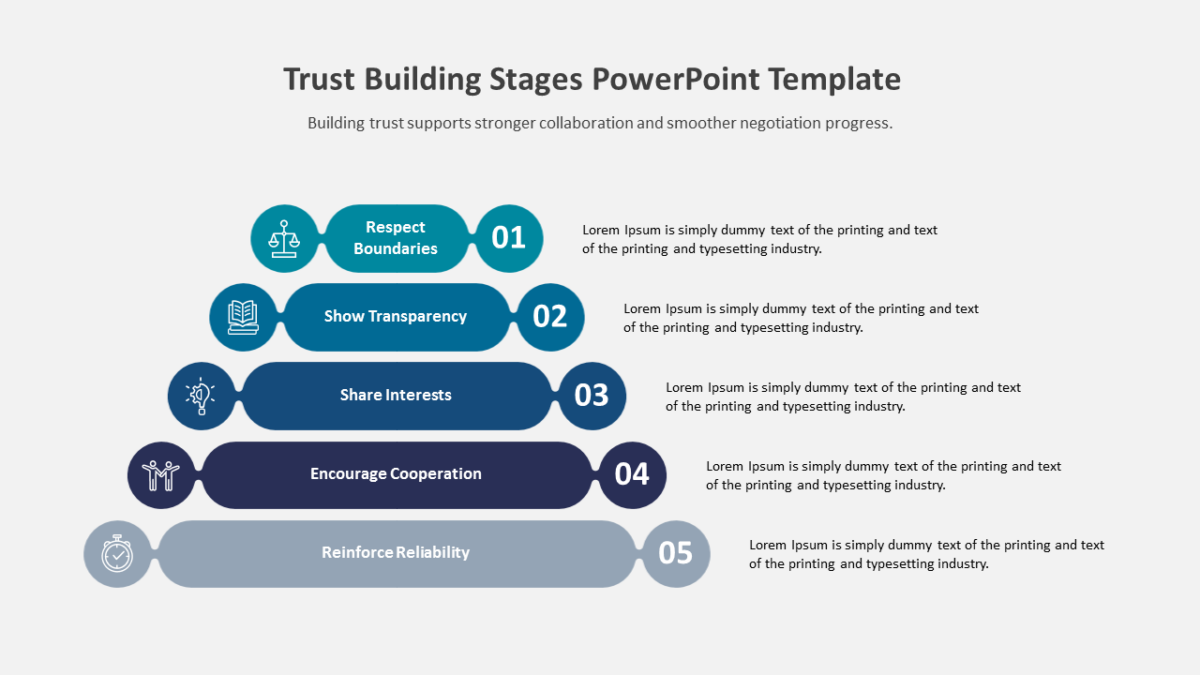
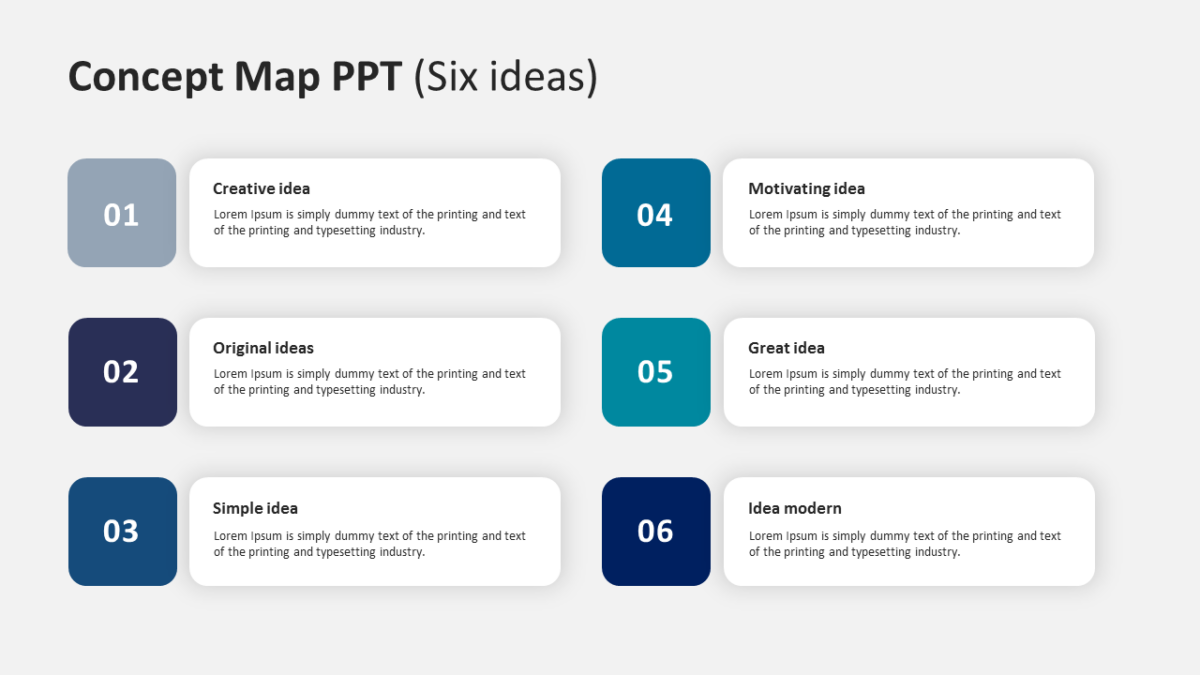
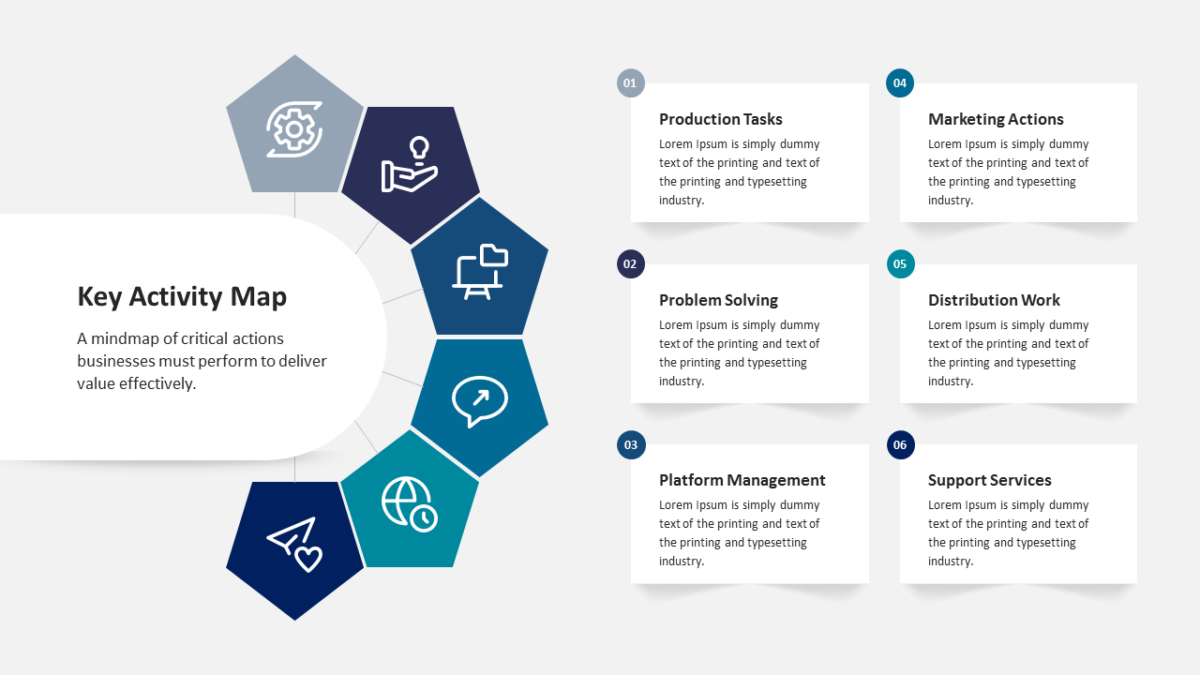
What’s on the slide
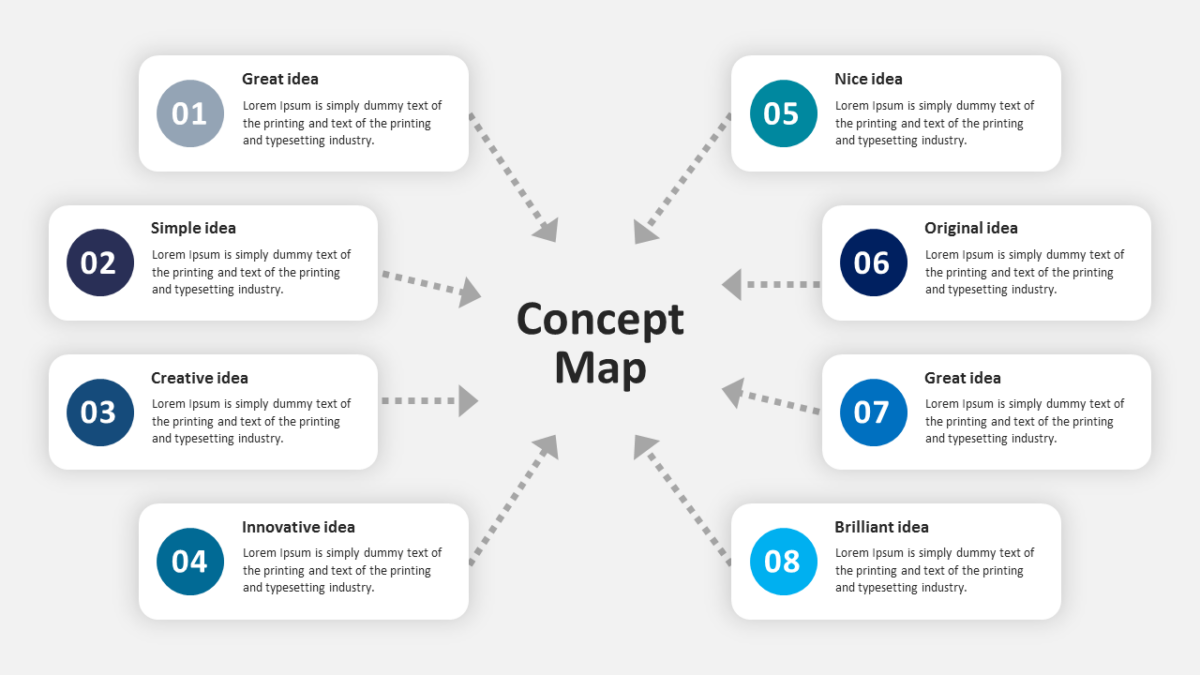
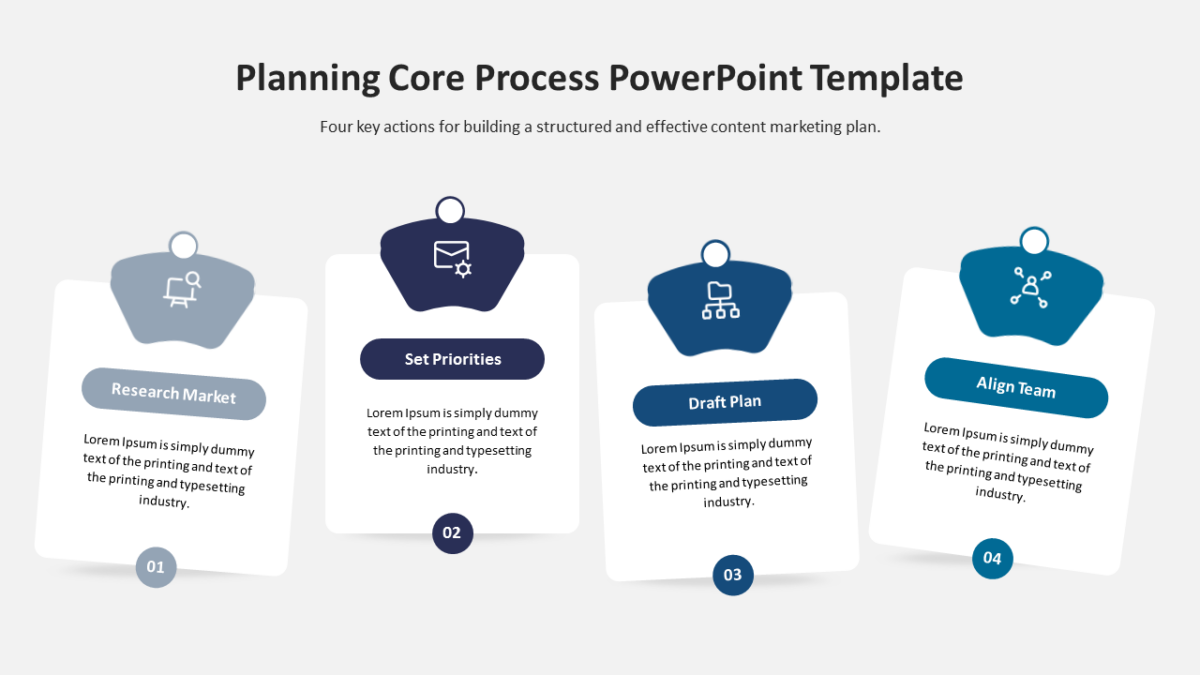
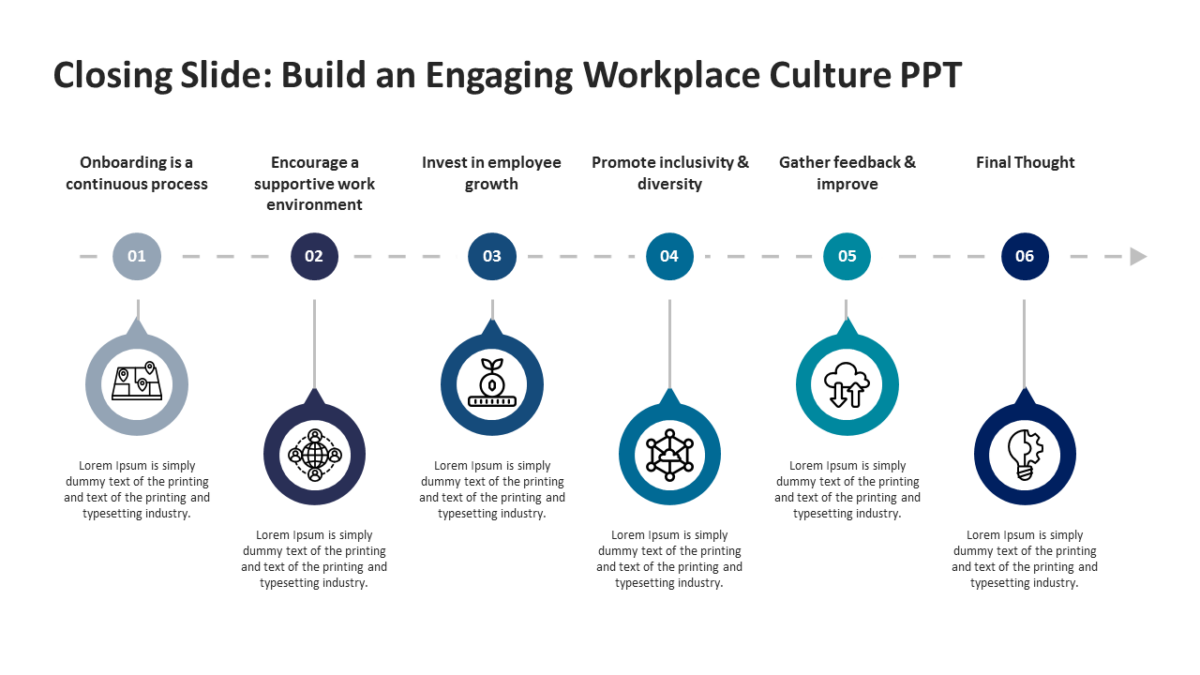
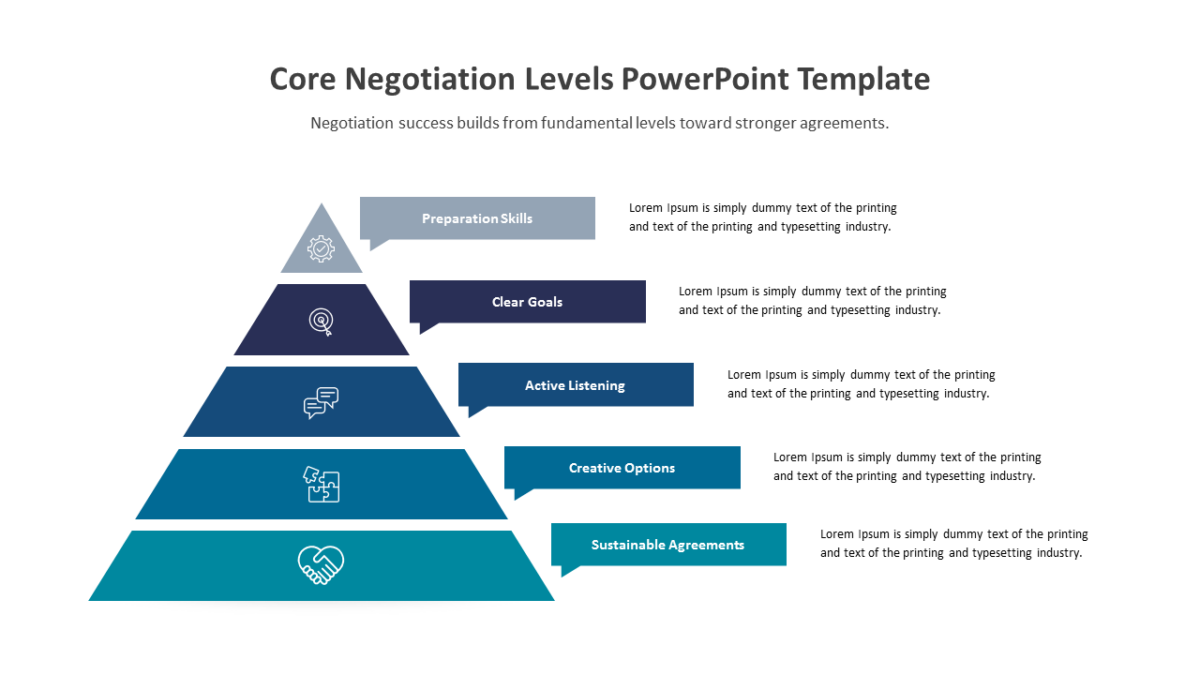
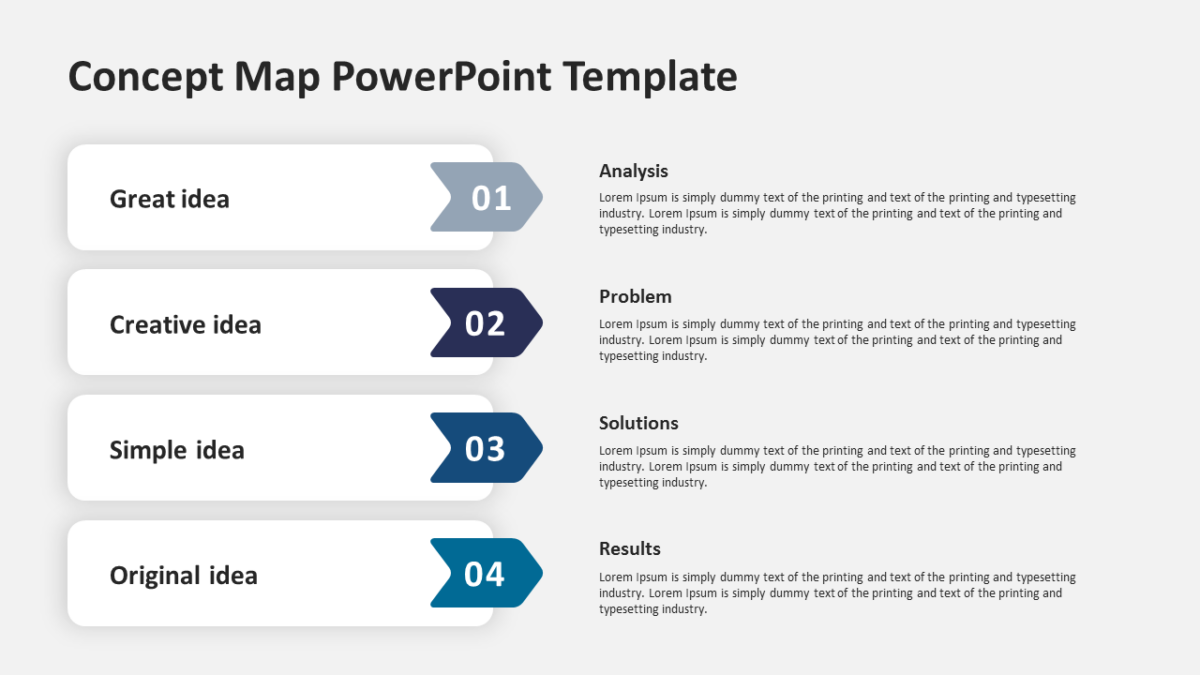
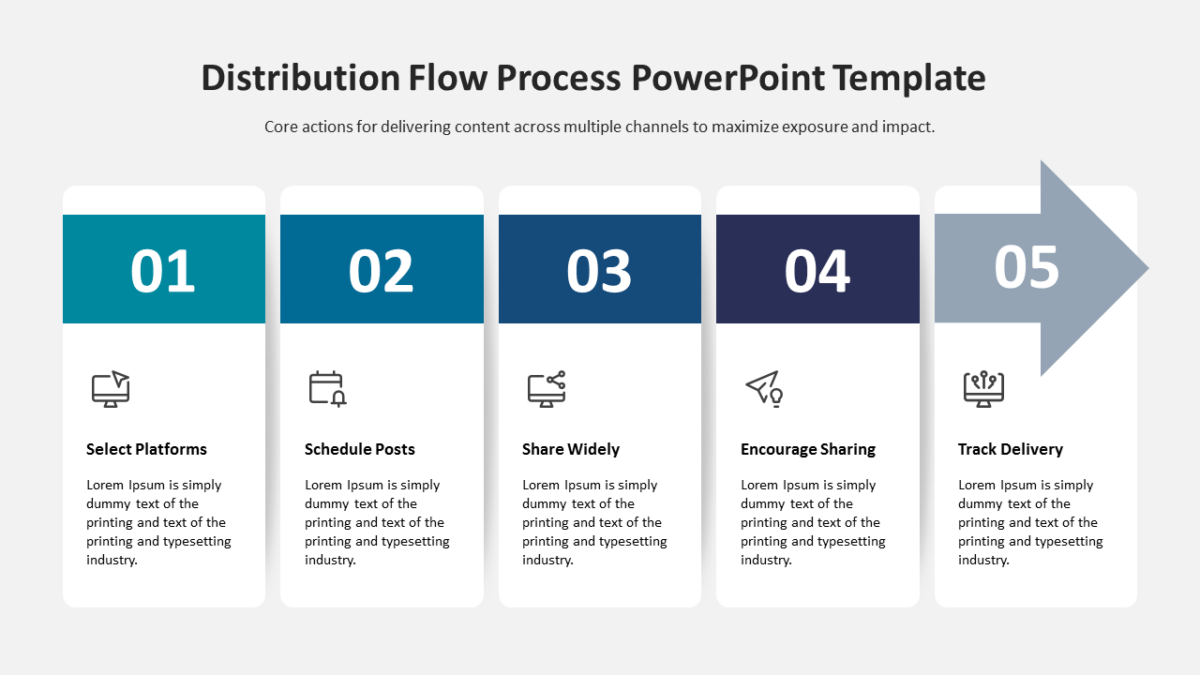
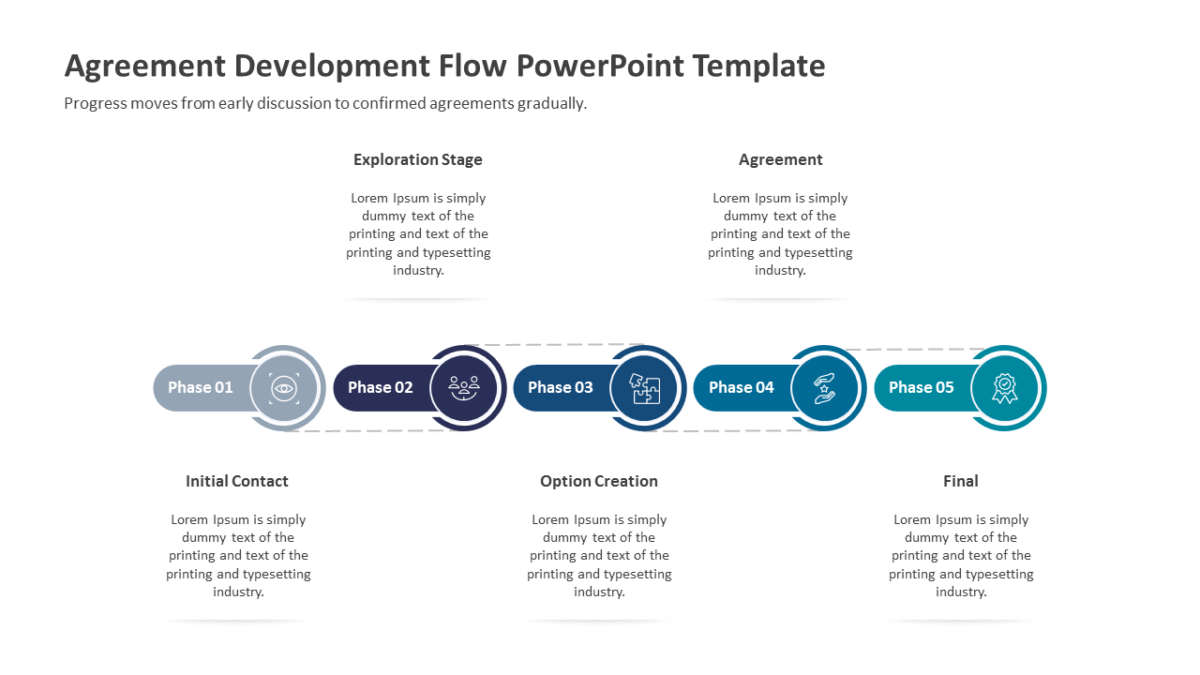
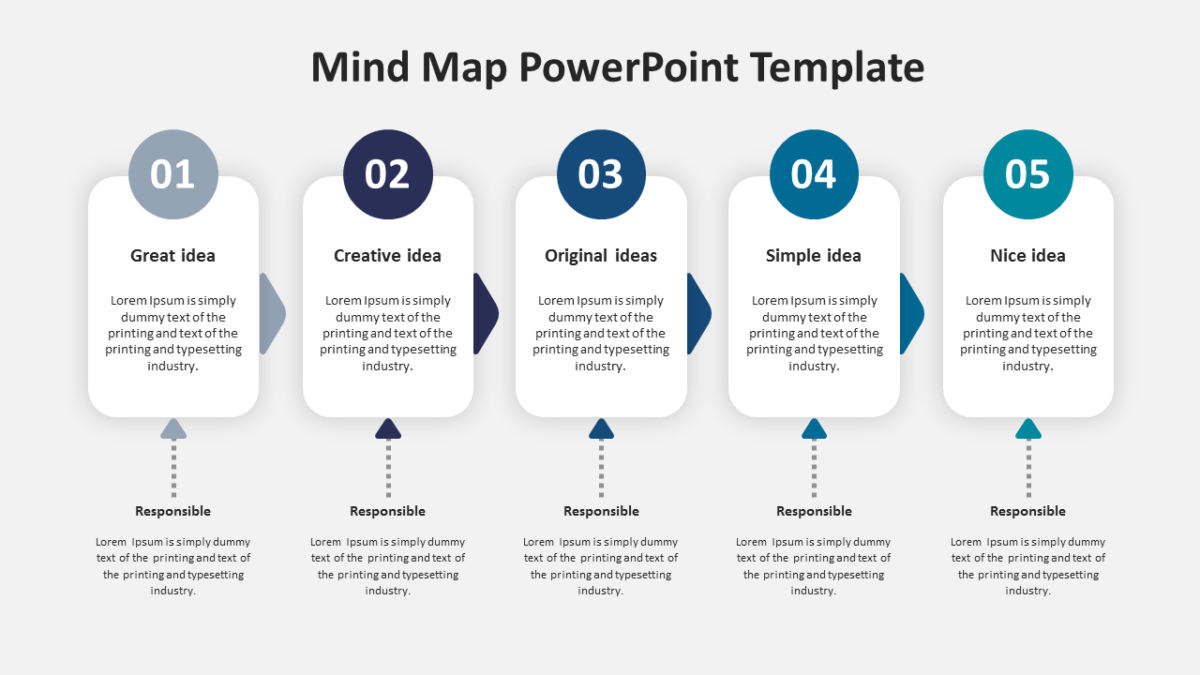
- Balanced visual blocks aligned on a consistent grid
- Icon placeholders throughout
- A heading and short text area per element
- Clear visual separation between points
- Title and subtitle area at the top
Every element is a native PowerPoint shape, so colors, icons and copy are all yours to change. Sized 16:9, and it opens cleanly in Google Slides and Keynote.
Finance managers will use it most often. So will financial analysts, and it holds up for controllers too. It works mid-deck, wherever one slide needs to hold several related points. Pair it with anything from the workflow templates to keep a deck consistent.