KPI Highlight Chart PowerPoint Templates.pptx
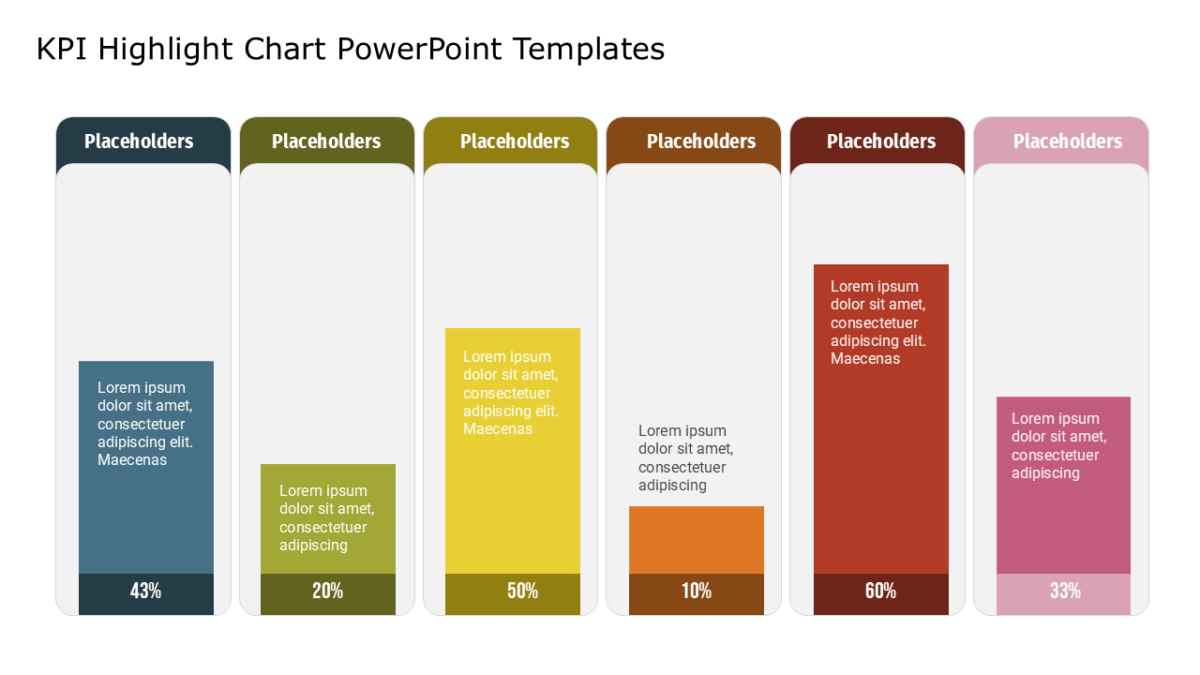
Status reviews run faster off a single panel, and the KPI Highlight Chart PowerPoint Templates is that panel.
The point of a finance slide is not to show every figure. It is to show the shape of the figures clearly enough that questions get specific.
What’s on the slide
- A grid of metric tiles
- A short note field beneath each number
- Consistent tile sizing for clean scanning
- Trend or progress indicators per metric
All of it is editable, from the icon set to the fill colors to the text. 16:9 widescreen, compatible with PowerPoint, Google Slides and Keynote.
Controllers reach for this most, though commercial finance and finance managers get the same value out of it. Place it first, so the detail after has something to hang on. The wider set of dashboard templates picks up where this one leaves off.