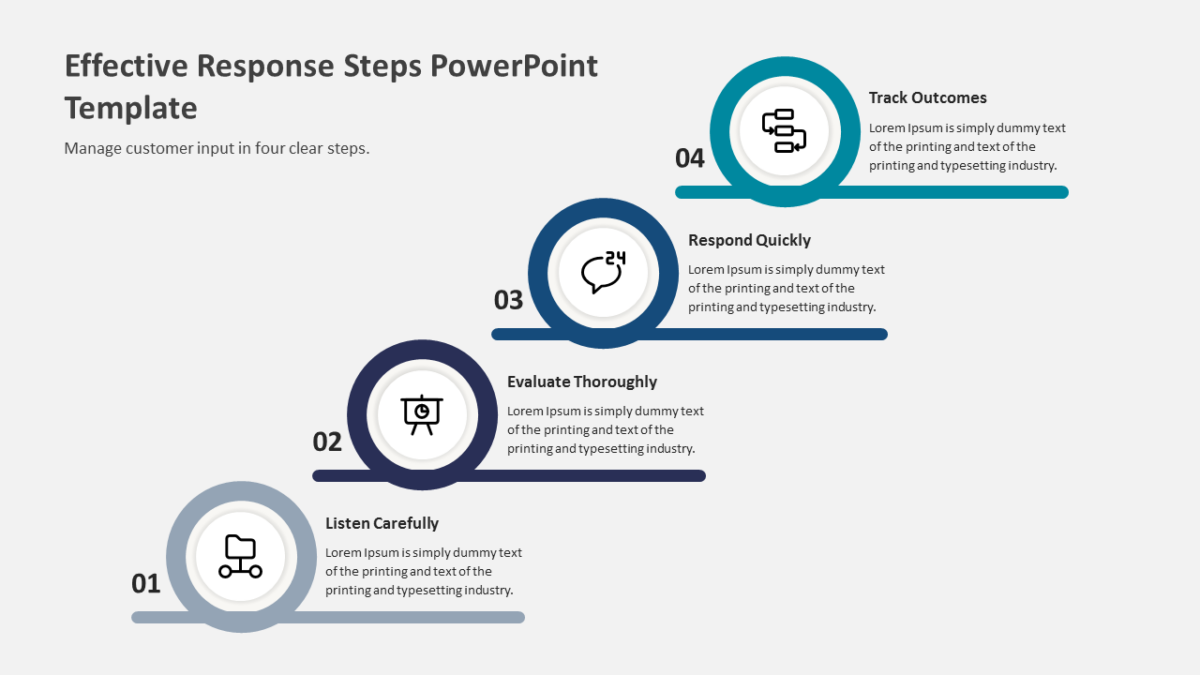
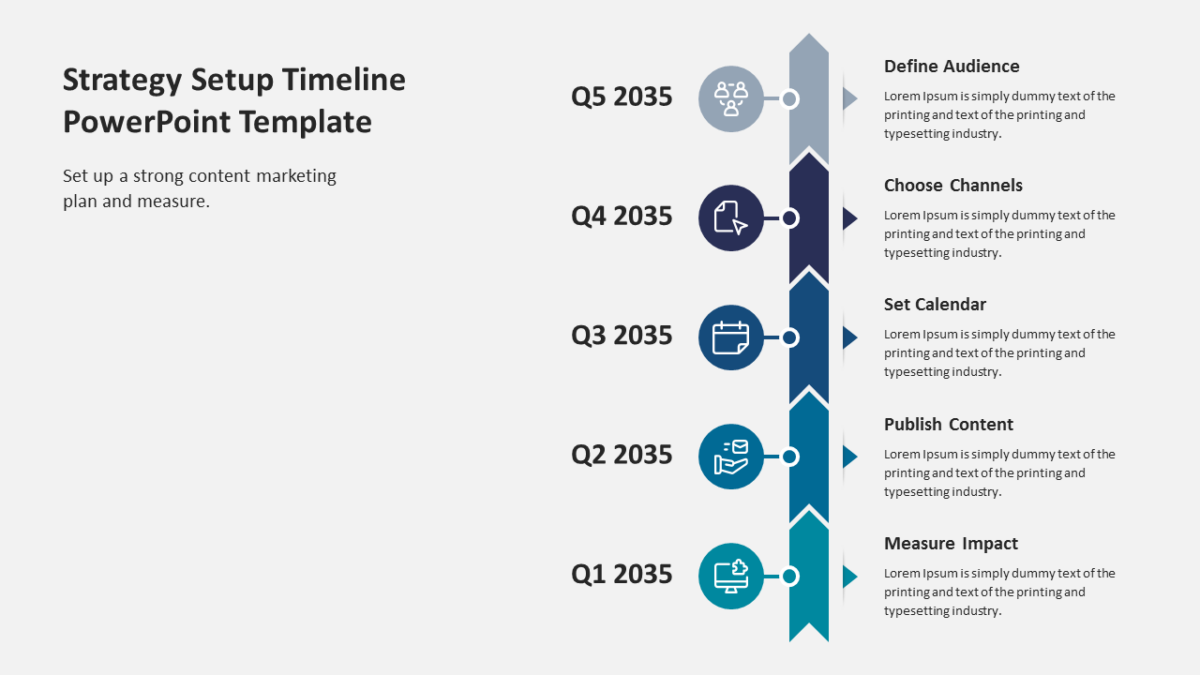
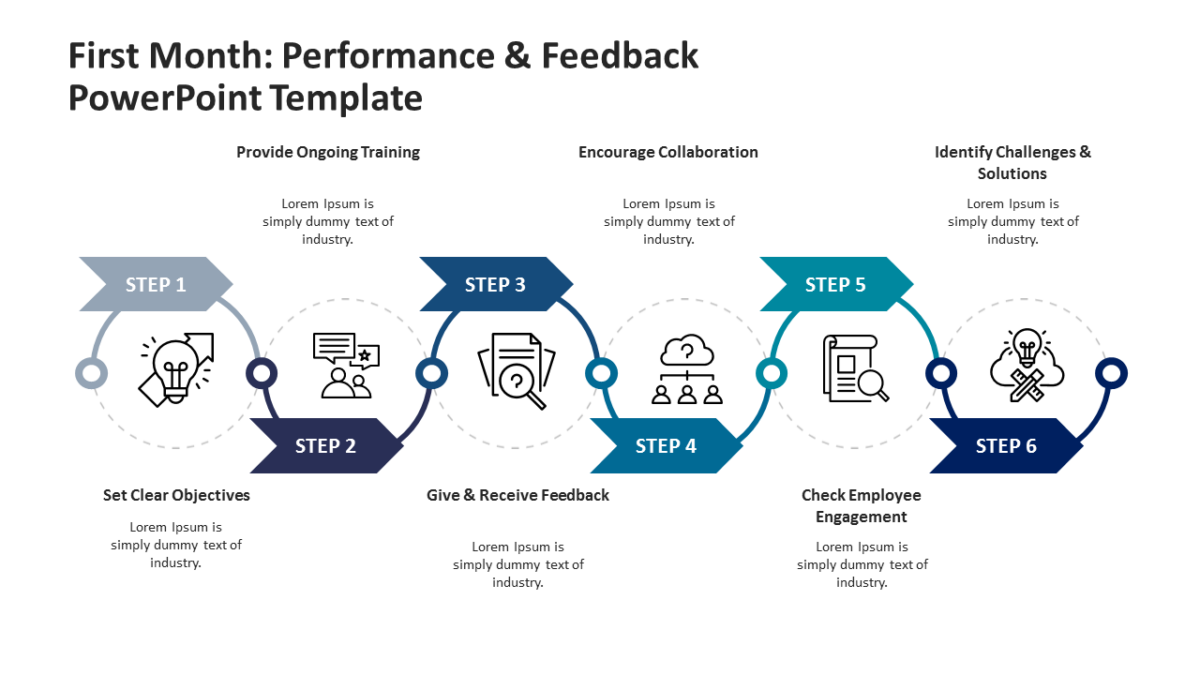
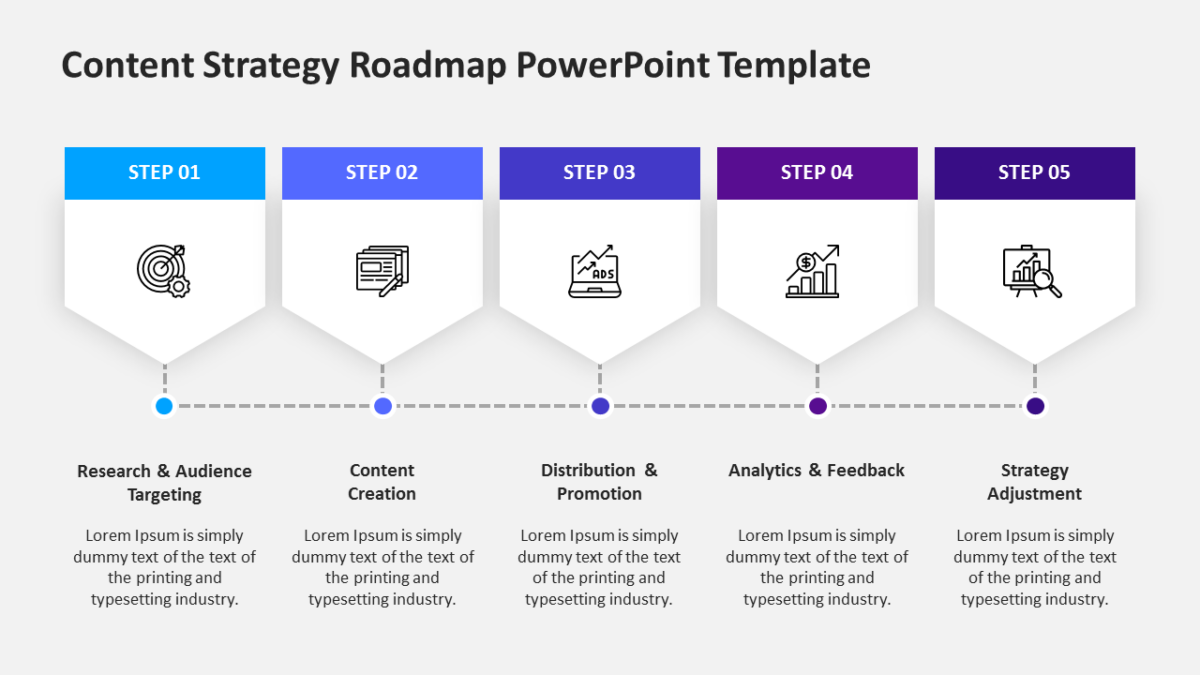
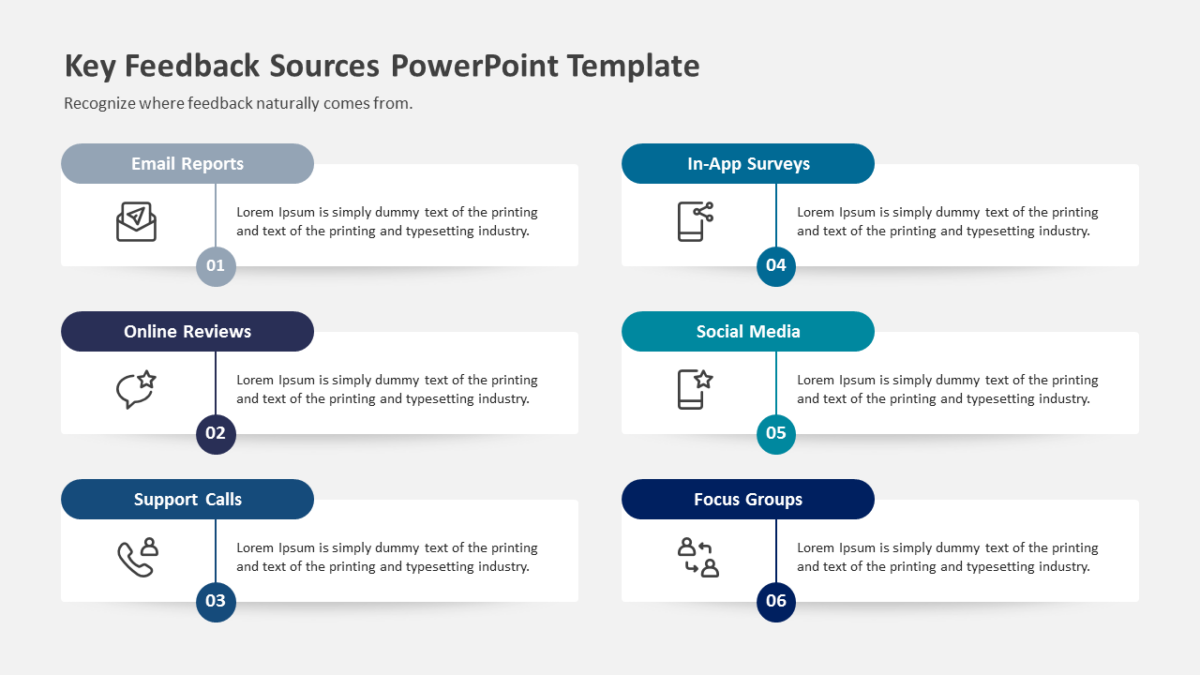
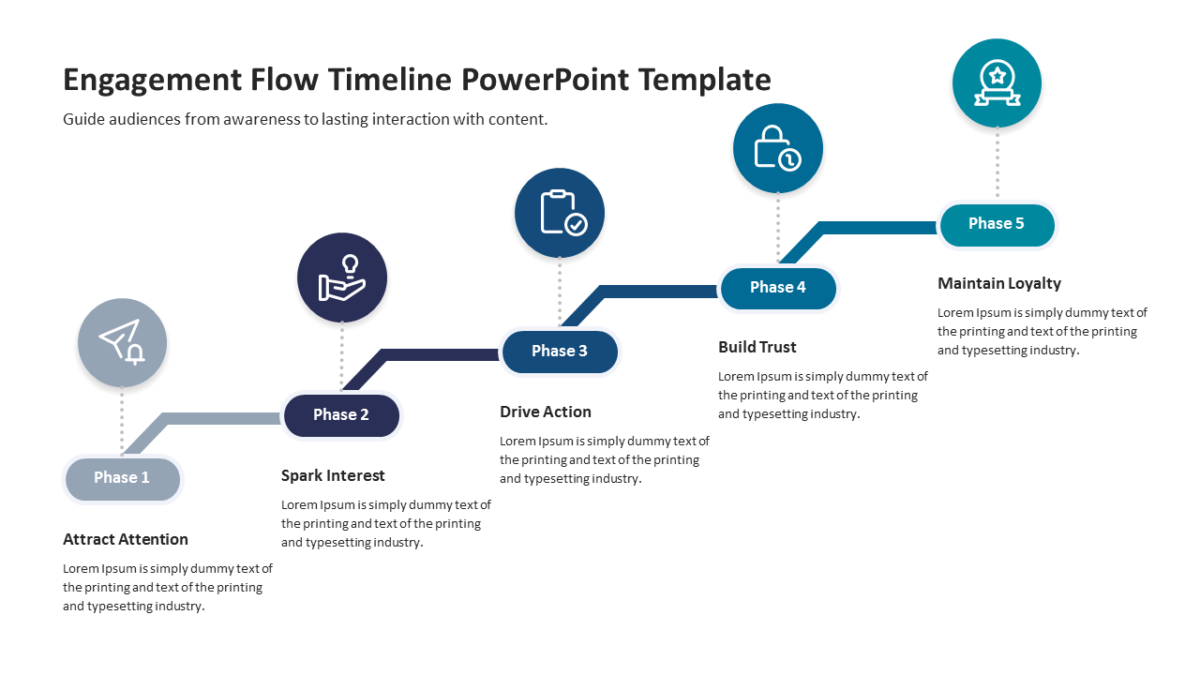
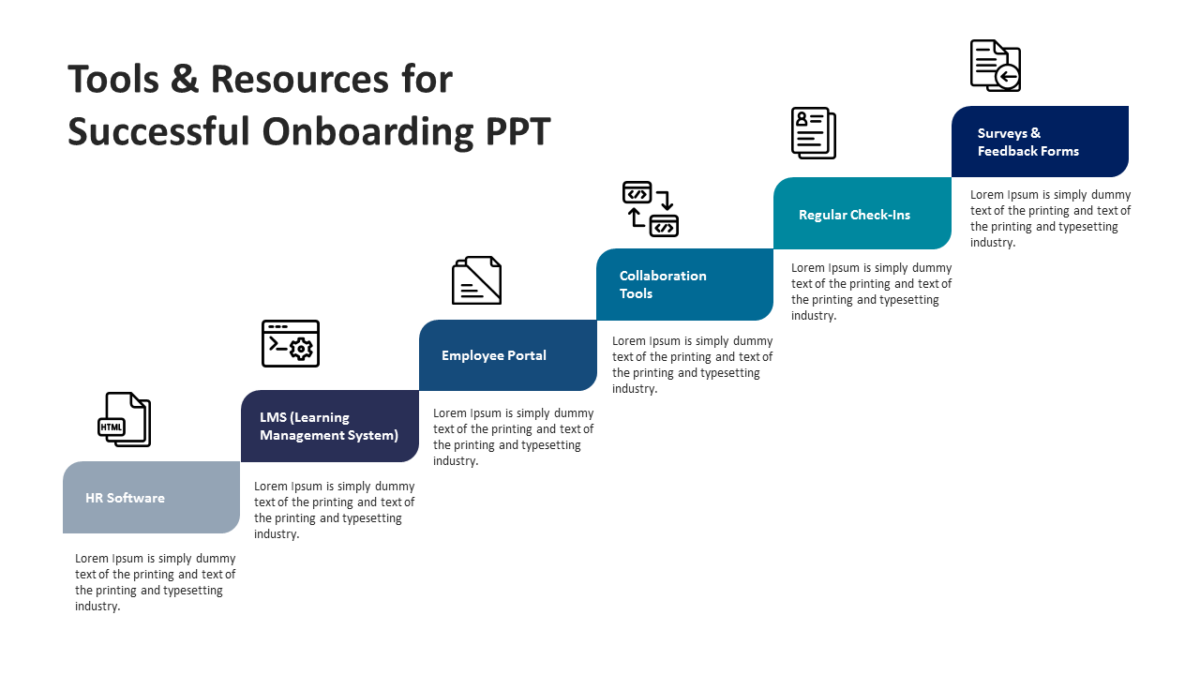
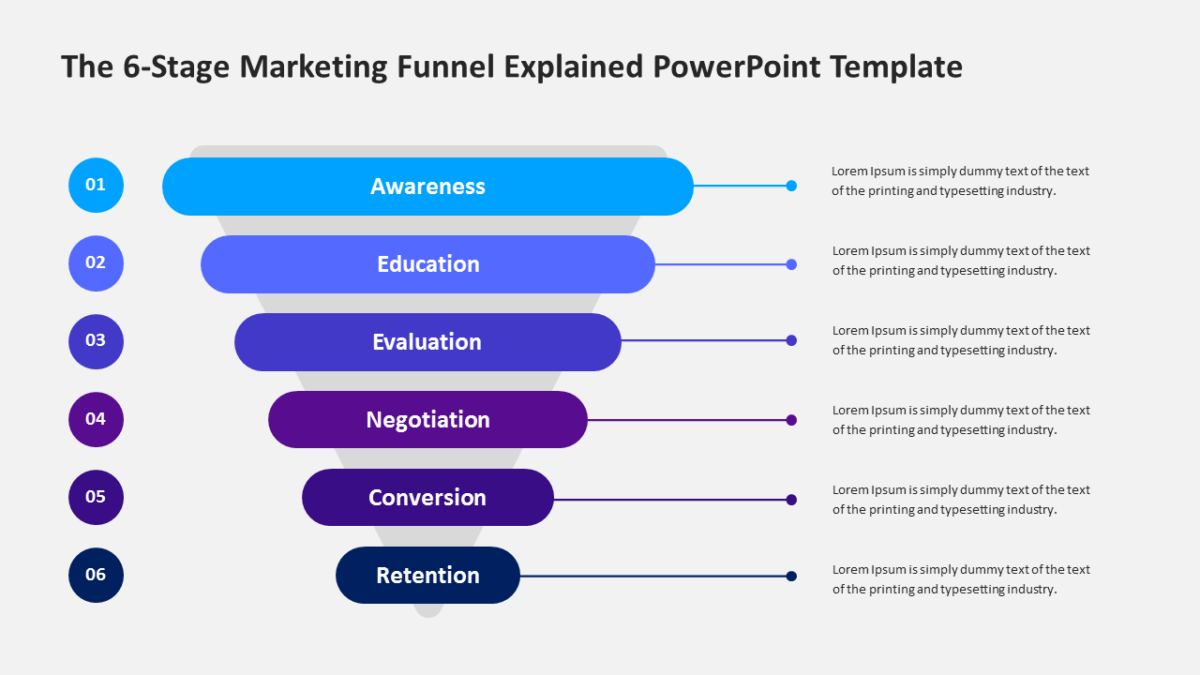
3 Phase Process Flow Infographic
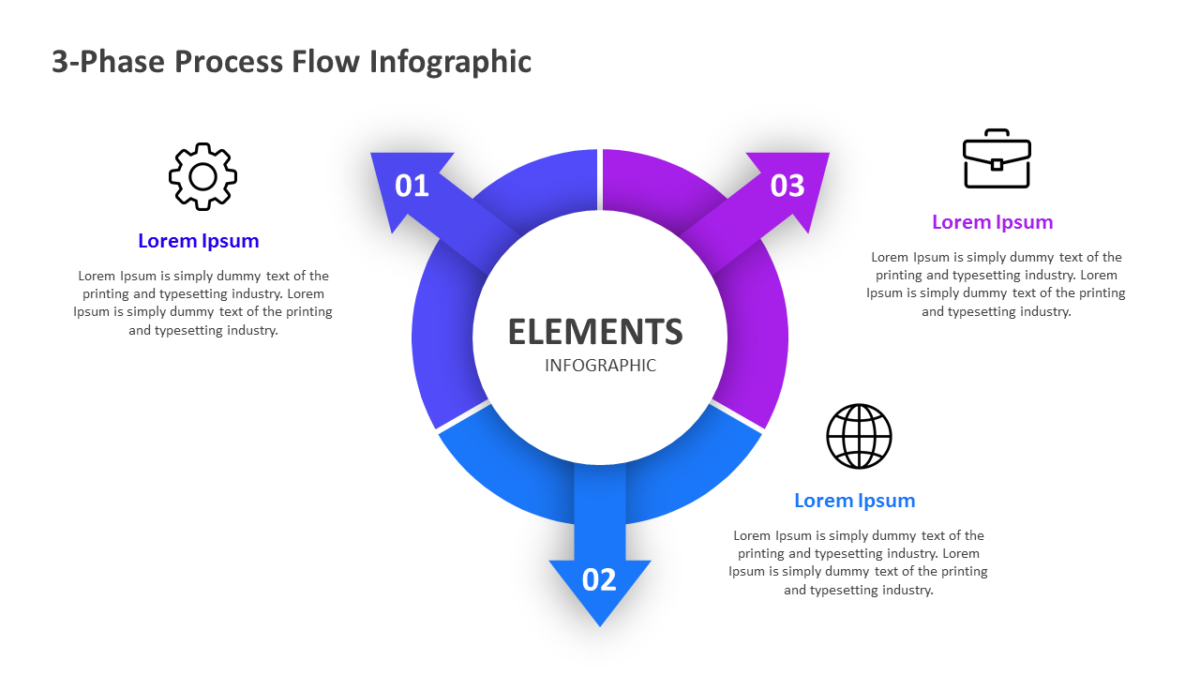
The 3 Phase Process Flow Infographic turns a set of steps into something the audience can point at and question.
Most decks lose people not through bad content but through slides that ask too much to decode. Good structure removes that tax.
What’s on the slide
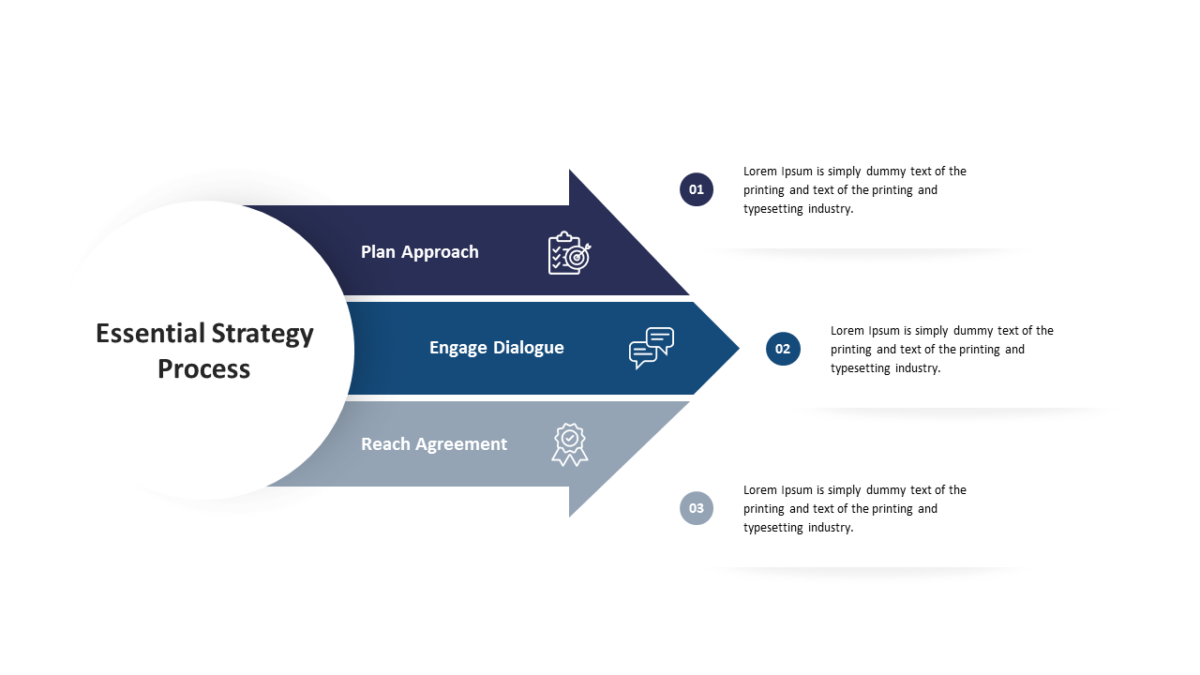
- 3 connected stages running across the slide, each numbered
- Connectors built into the graphic, so the sequence reads at a distance
- A heading and short description block per step
- Title and subtitle area at the top
- An icon placeholder on every stage
Nothing here is a flattened image. Shapes, fills, icons and text are individually editable, at 16:9, and the file behaves in Google Slides and Keynote too.
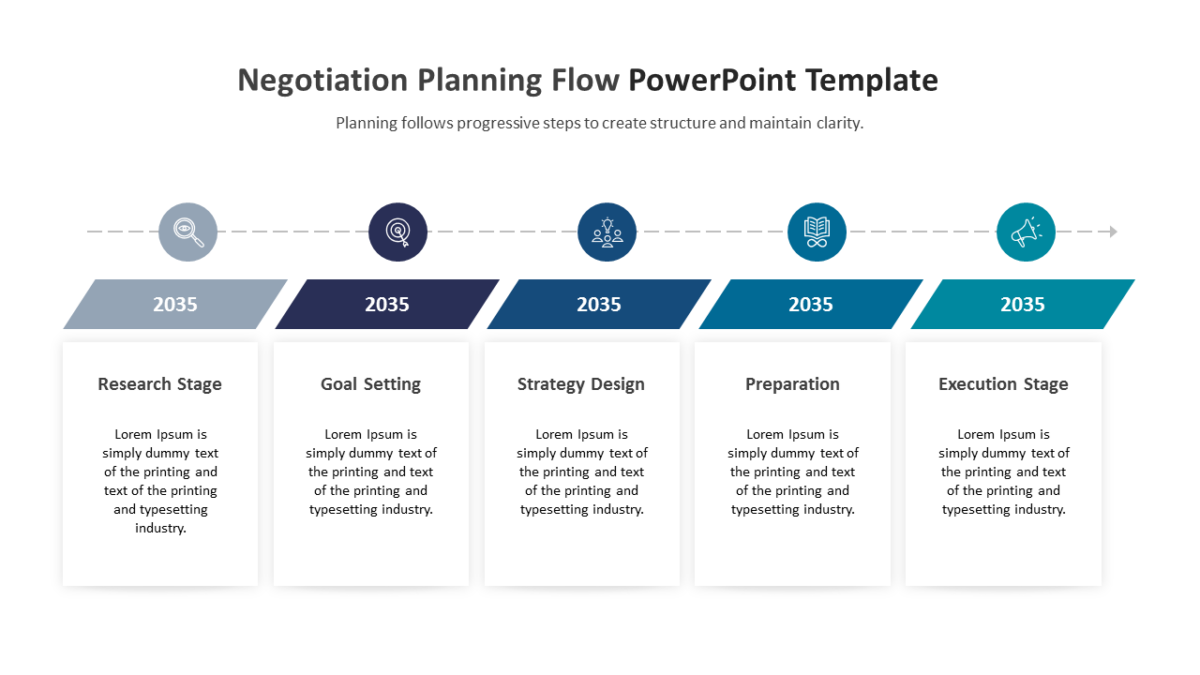
Team leads reach for this most, though consultants and executives get the same value out of it. Place it after your framing slide and before any results. The other process flow templates handle the same job at different scales.