Circle Style SWOT Analysis Diagram
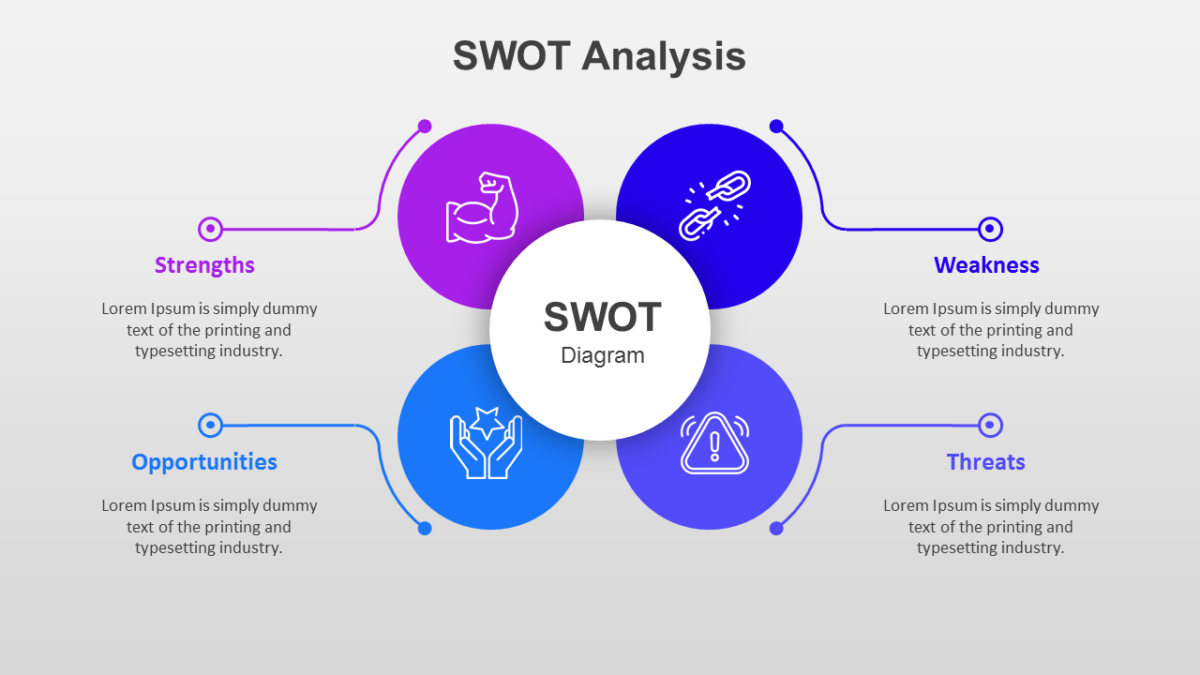
Everyone knows SWOT. The value in the Circle Style SWOT Analysis Diagram is that all four boxes stay readable from the back row.
Executive audiences decide fast and read little. A single well-built visual carries more of the argument than three slides of supporting prose.
What’s on the slide
- Four labeled quadrants covering strengths, weaknesses, opportunities and threats
- Central title area
- A color and icon assigned to each section
- Equal sizing across all four, so none dominates
- A bulleted text area inside every quadrant
Nothing here is a flattened image. Shapes, fills, icons and text are individually editable, at 16:9, and the file behaves in Google Slides and Keynote too.
It lands with executives first, then corporate development, and founders run into the same problem often enough to want it. Place it after market context and before your recommendation. Similar builds sit among the business strategy templates.