Sales Pipeline Development Timeline PowerPoint Infographic
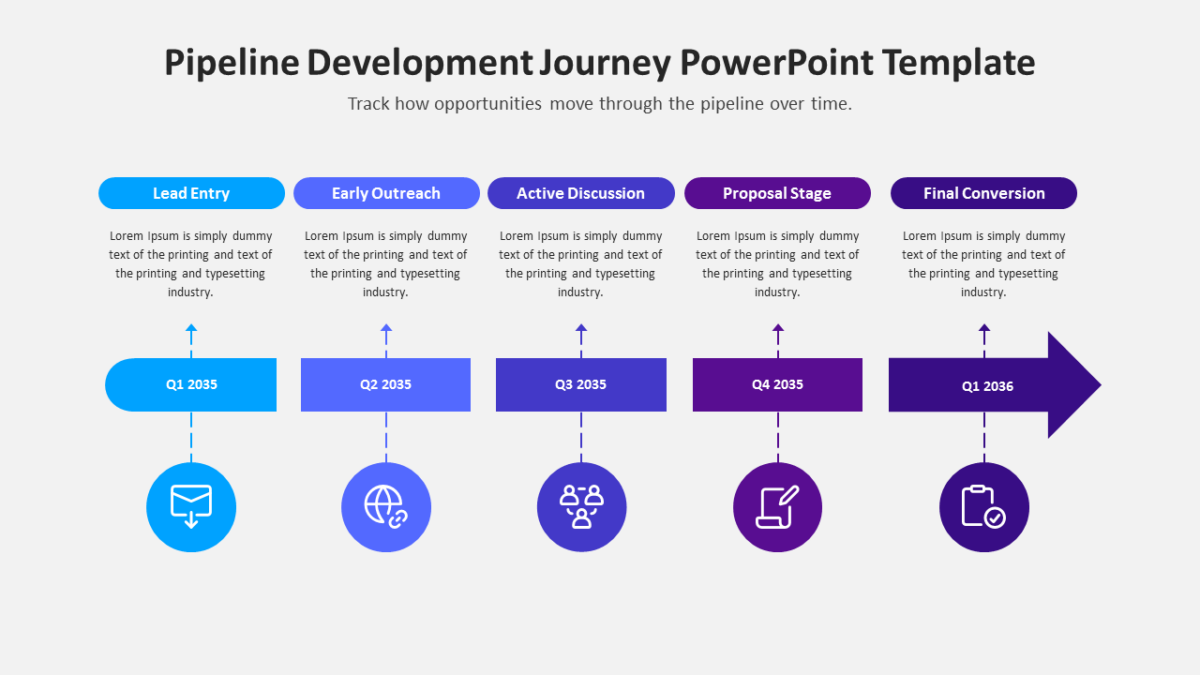
Progress is easier to defend when it is drawn. The Sales Pipeline Development Timeline PowerPoint Infographic draws it.
Sales conversations move faster when both sides can see the same picture. A shared visual takes the process out of the rep’s head and puts it somewhere the buyer can respond to.
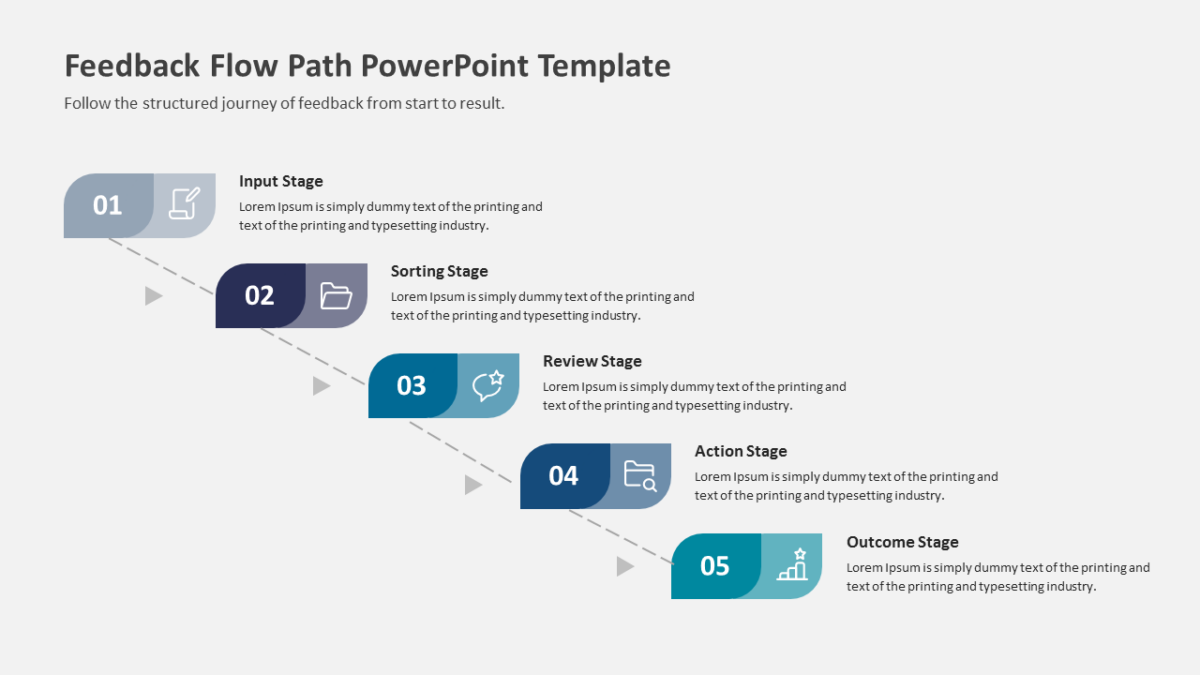
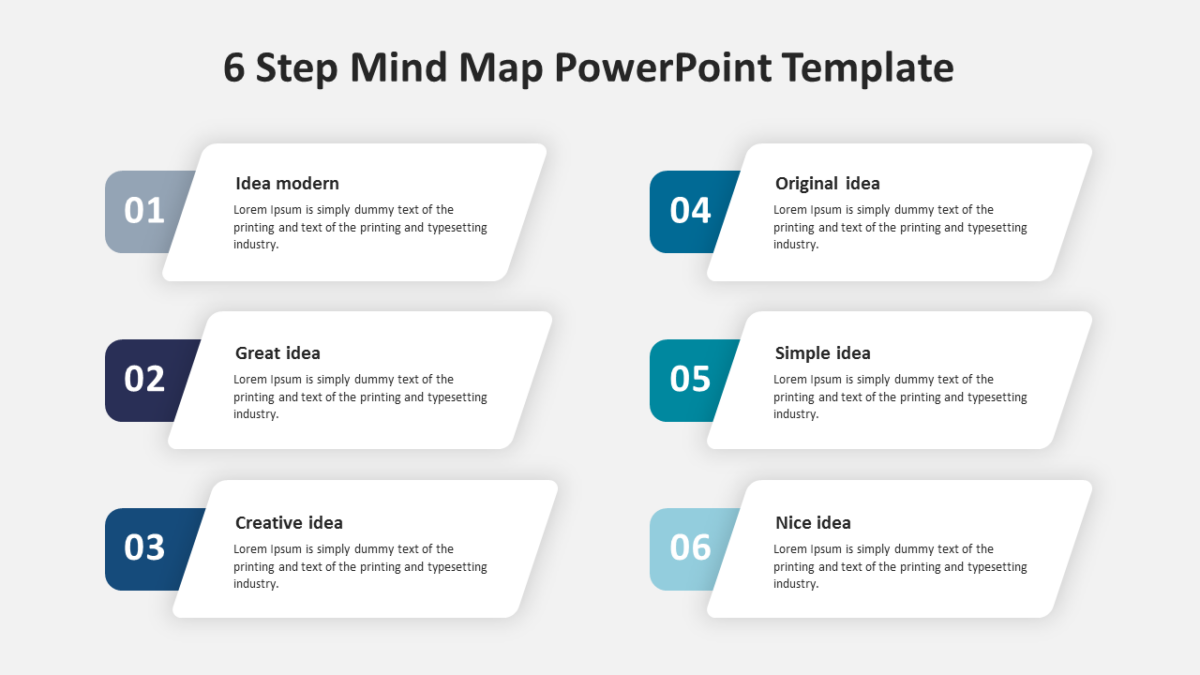
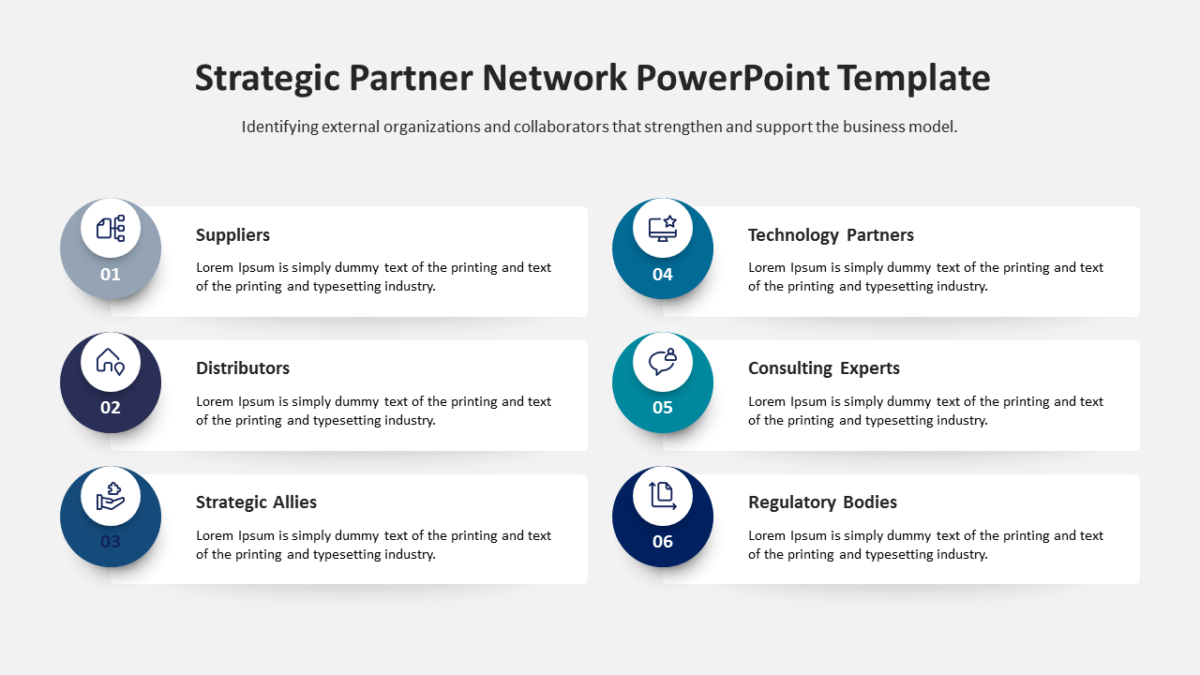
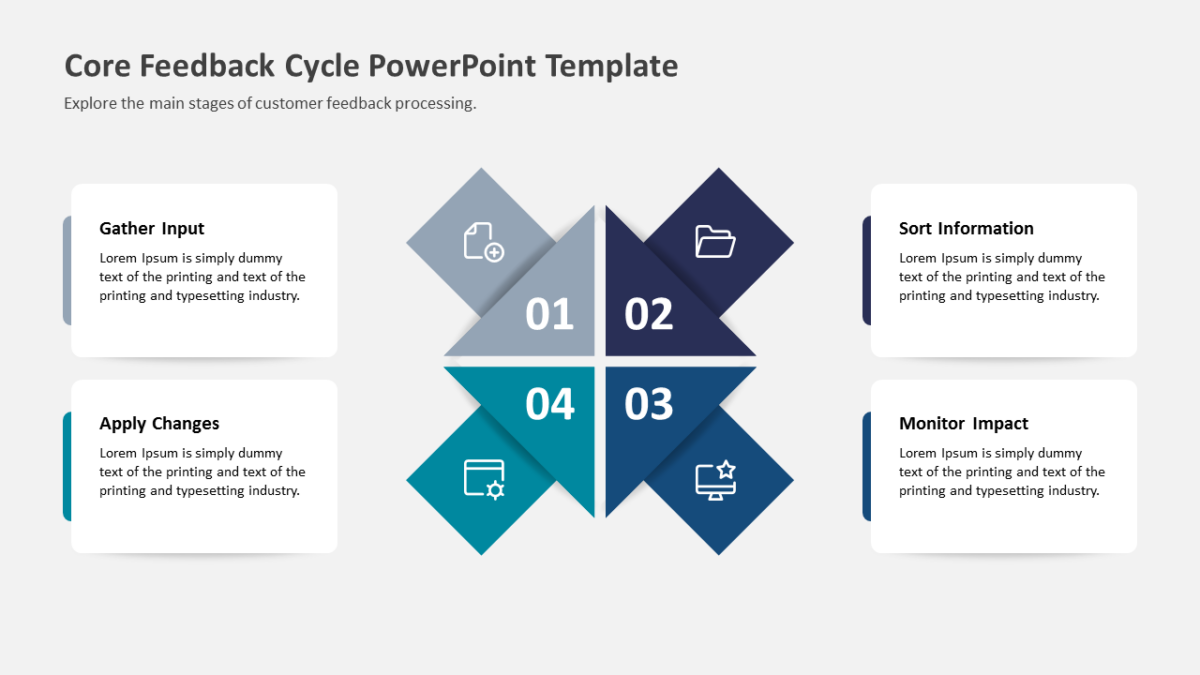
What’s on the slide
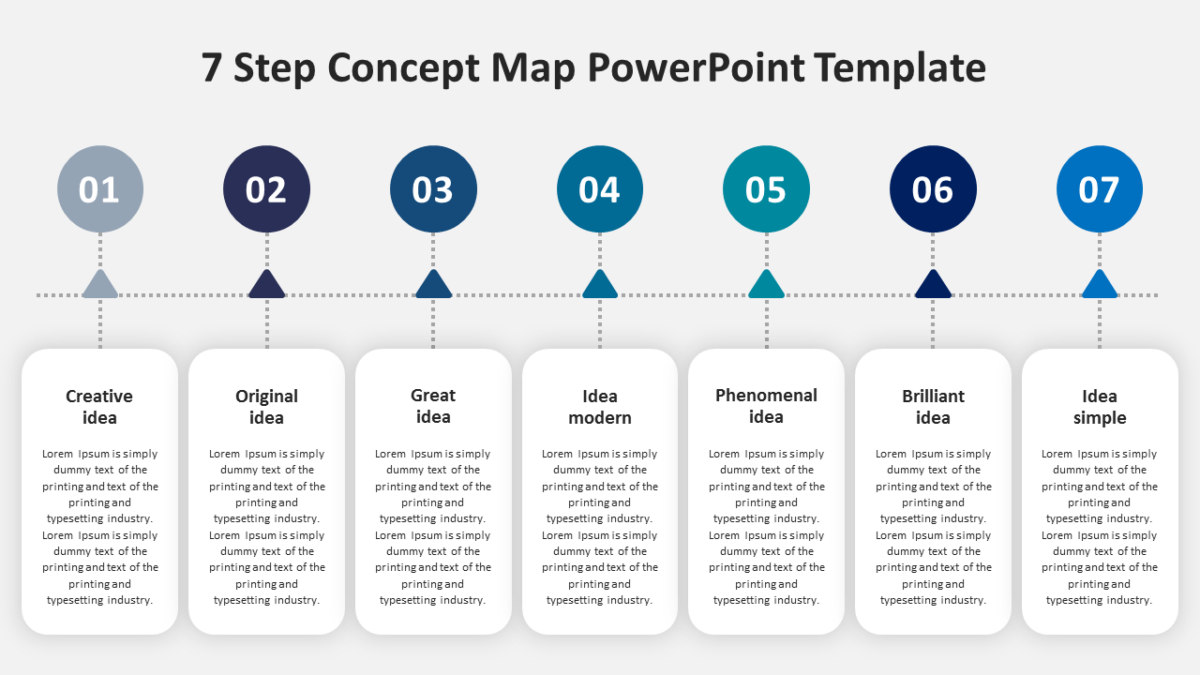
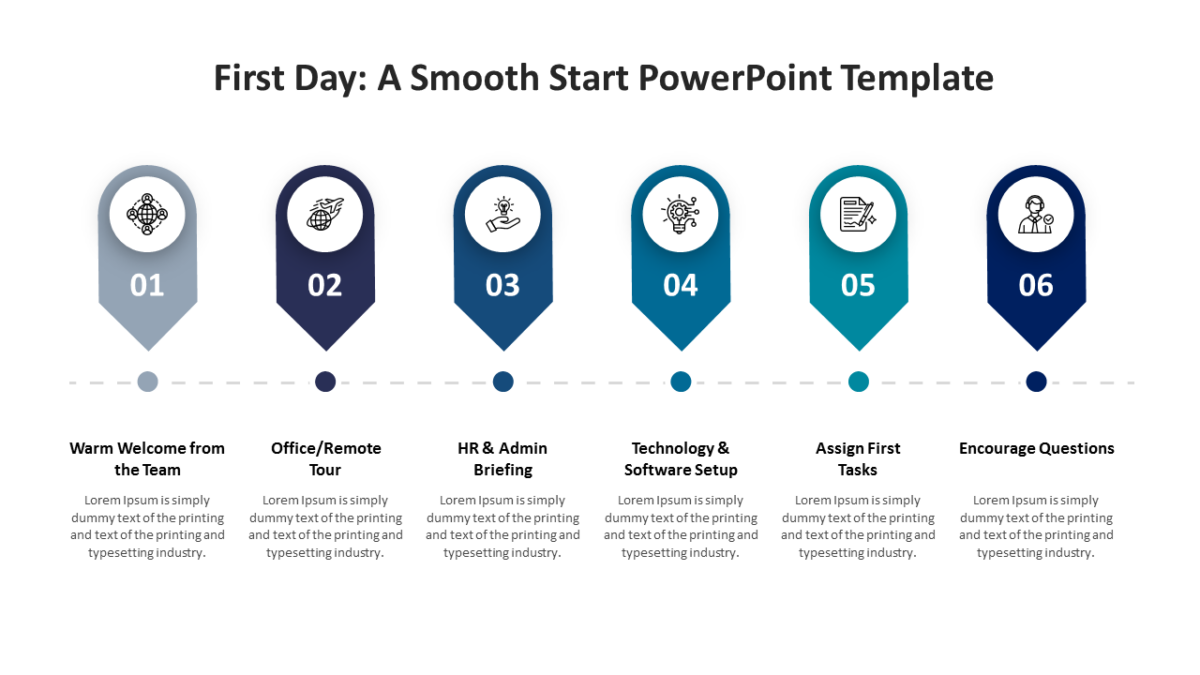
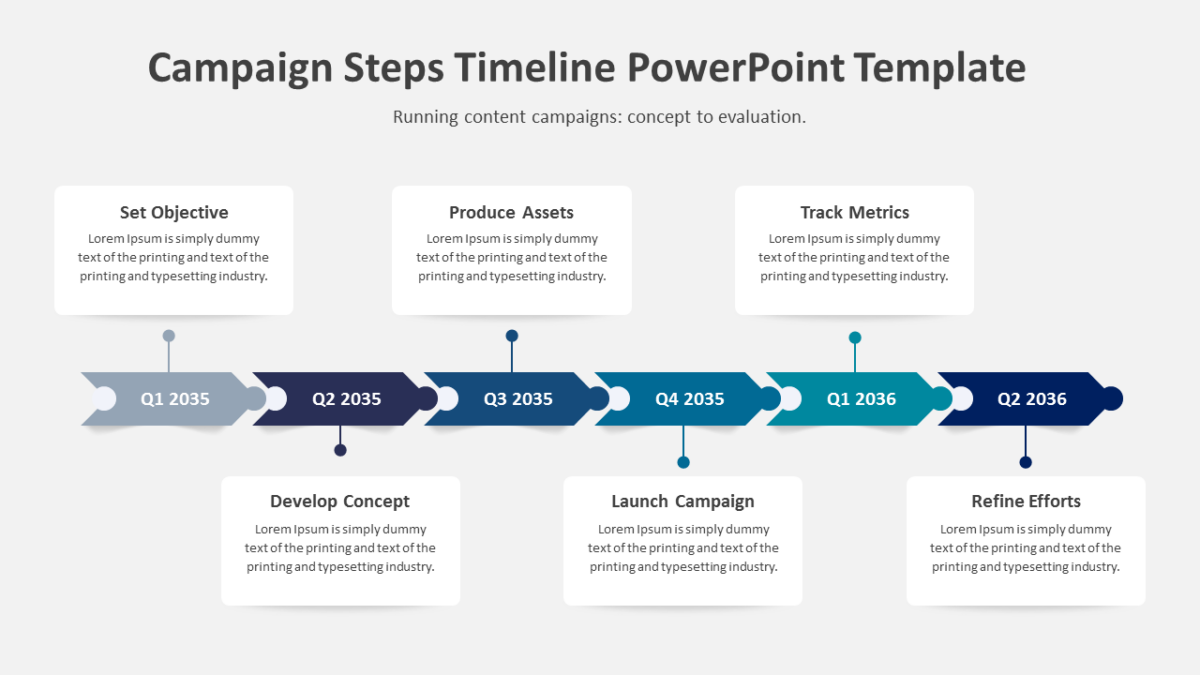
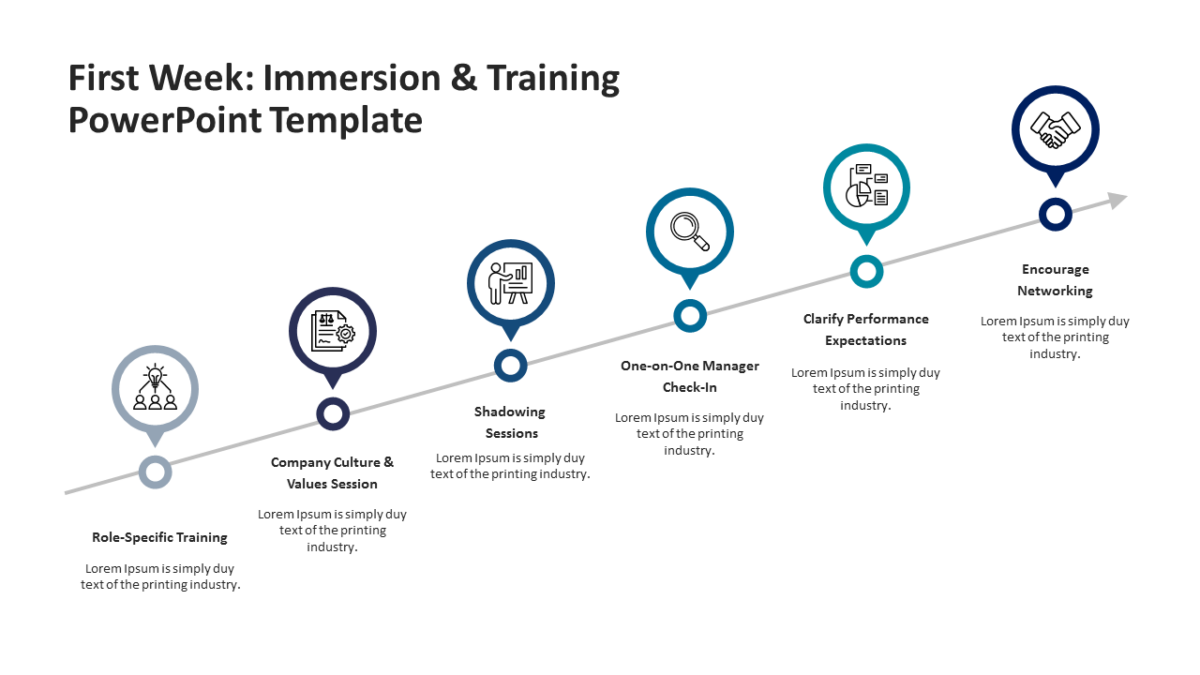
- A horizontal timeline axis with marked points
- Date or period labels on every marker
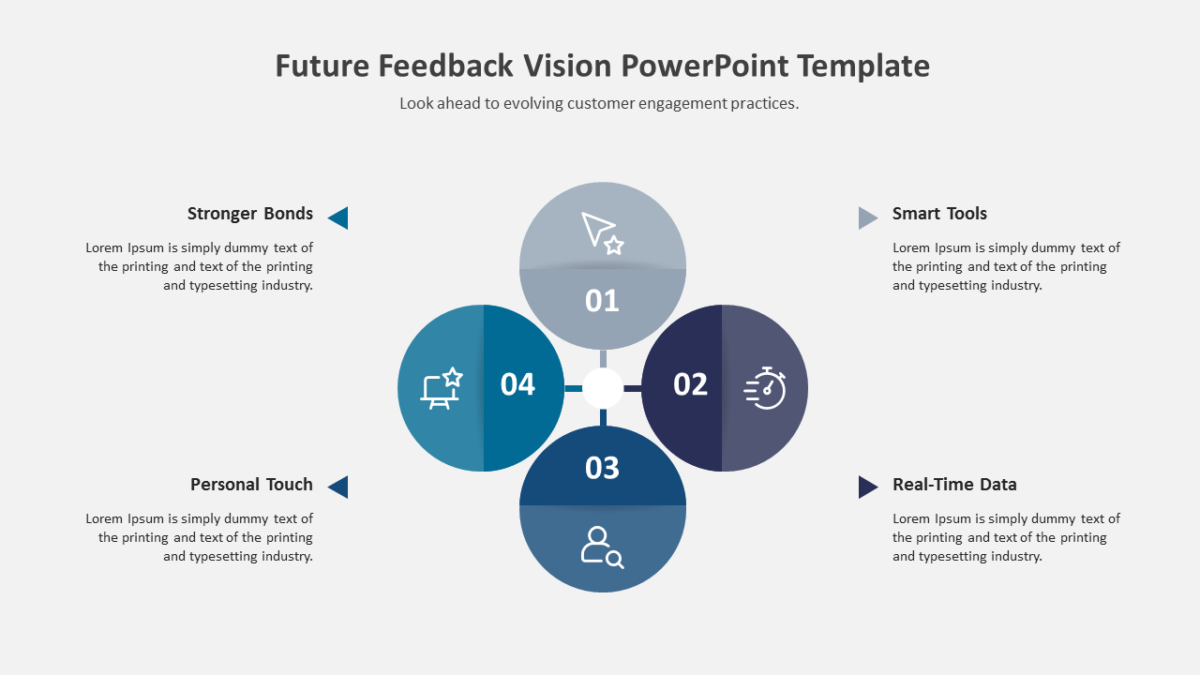
- A heading and note field per milestone
- Icon slots at each point on the track
Nothing here is a flattened image. Shapes, fills, icons and text are individually editable, at 16:9, and the file behaves in Google Slides and Keynote too.
It lands with account executives first, then sales enablement, and sales managers run into the same problem often enough to want it. It works early as history or late as schedule, and reads naturally either way. Browse the business strategy templates to compare a few layouts before committing.