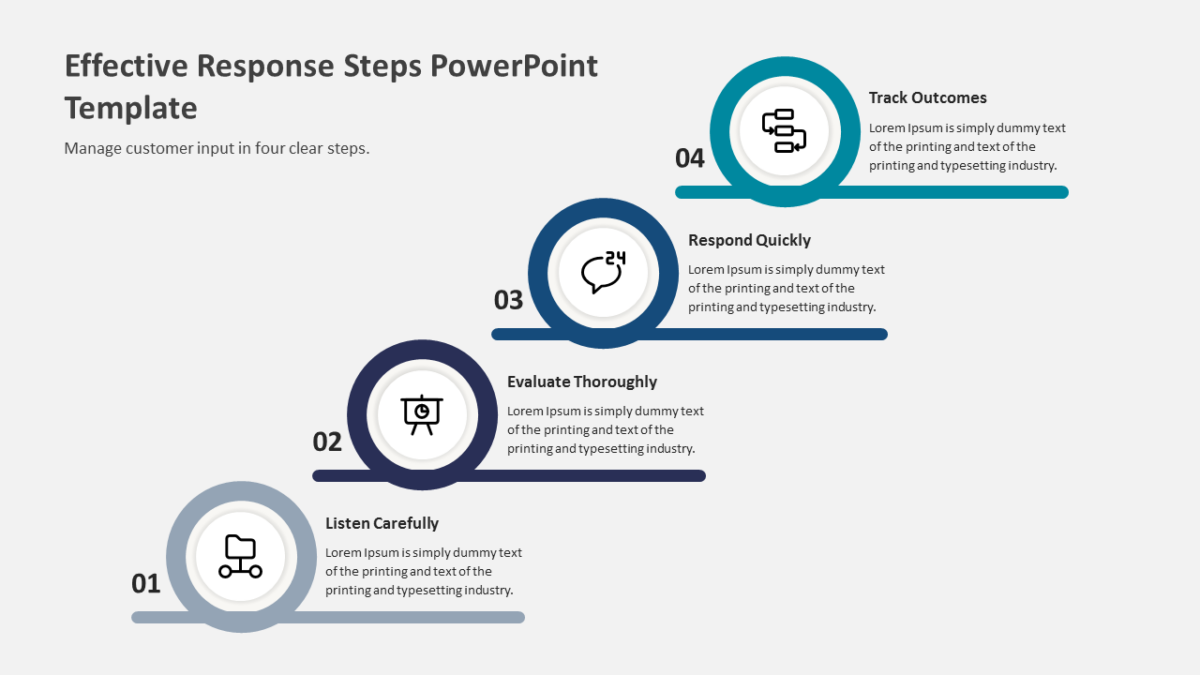
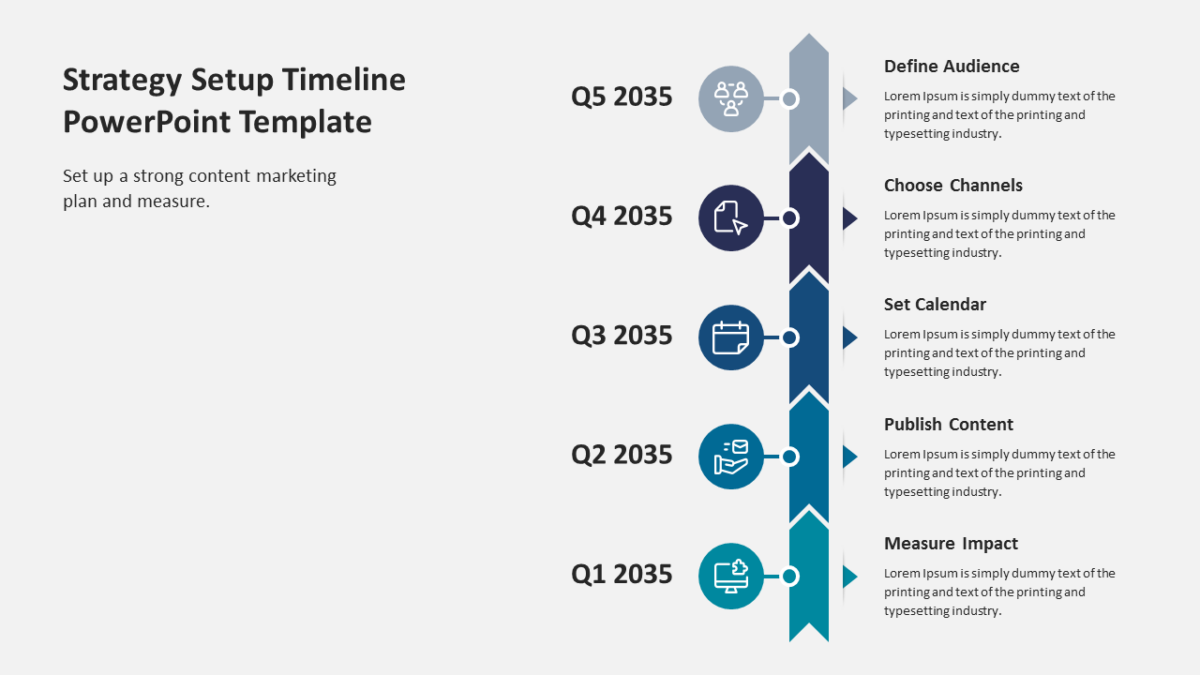
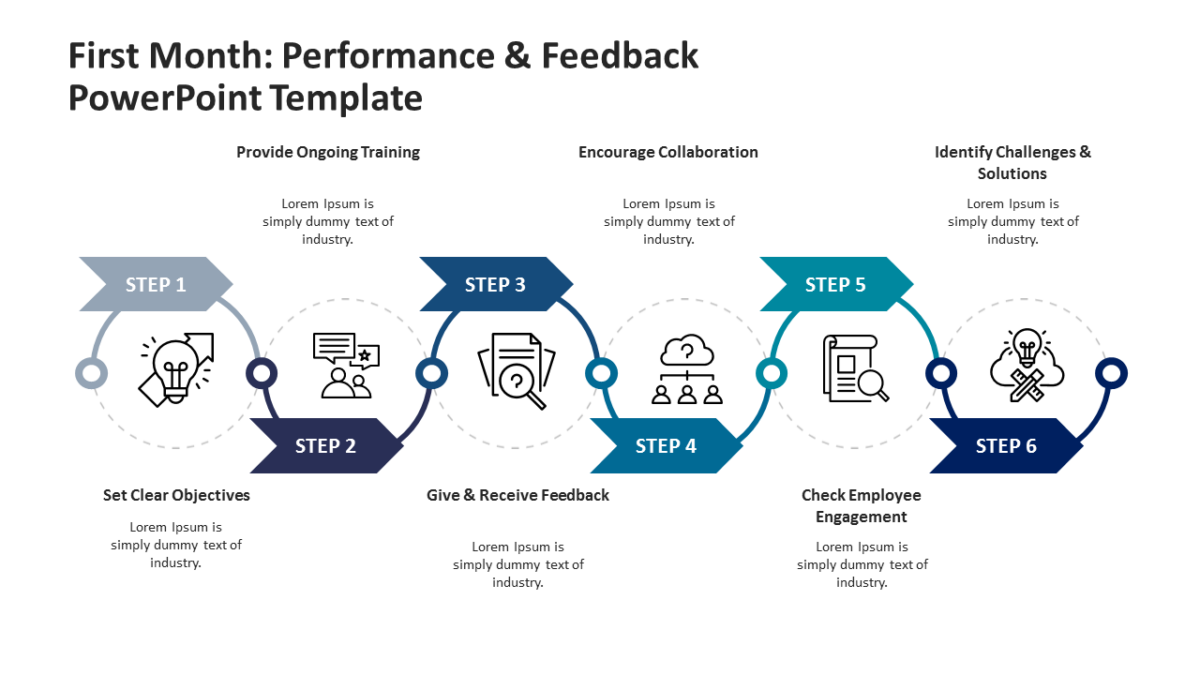
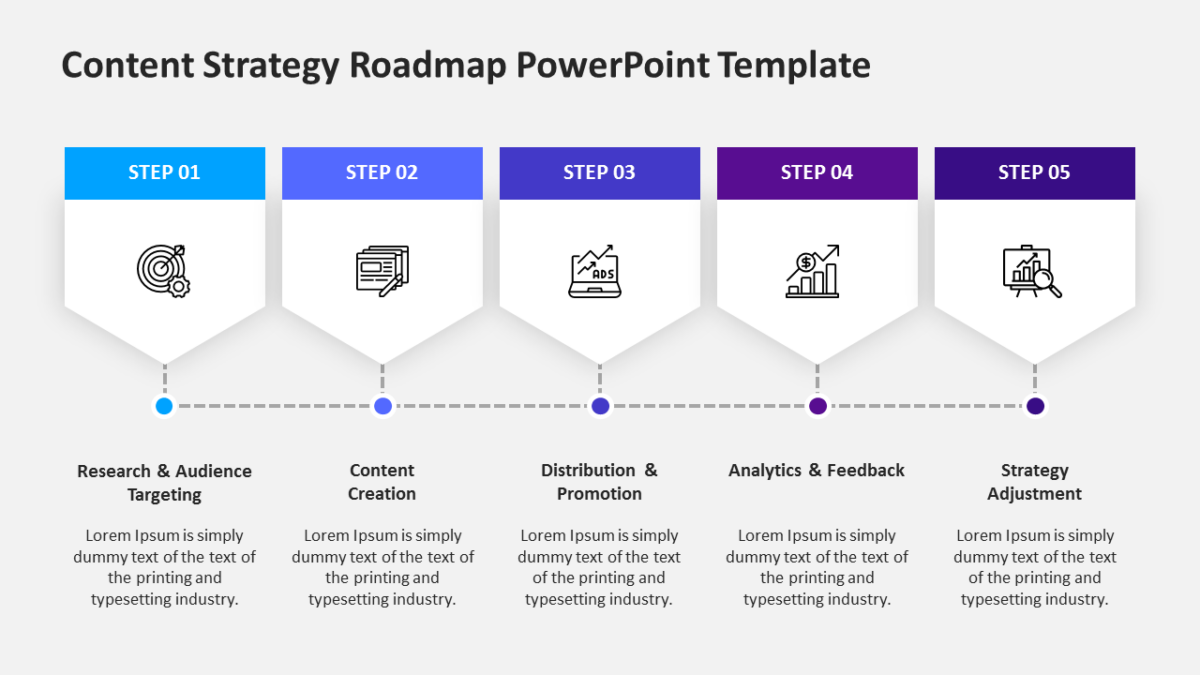
10 Step Timeline Infographic for Project Planning
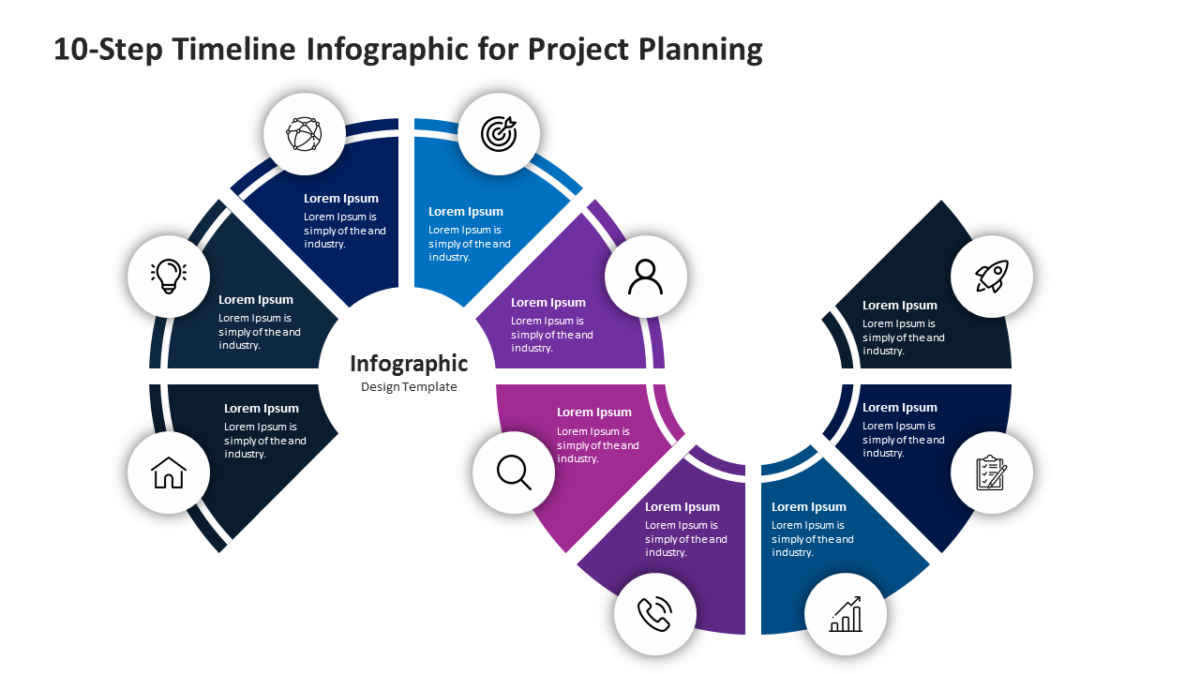
A schedule in a table is a document. A schedule on the 10 Step Timeline Infographic for Project Planning is a conversation.
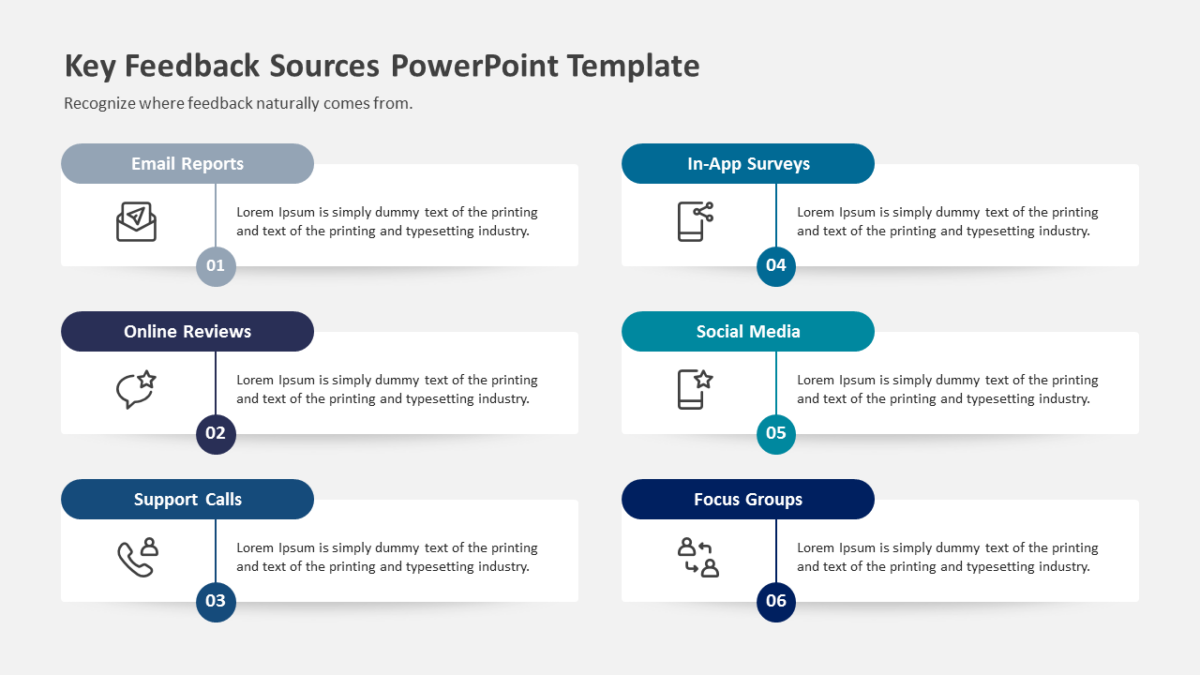
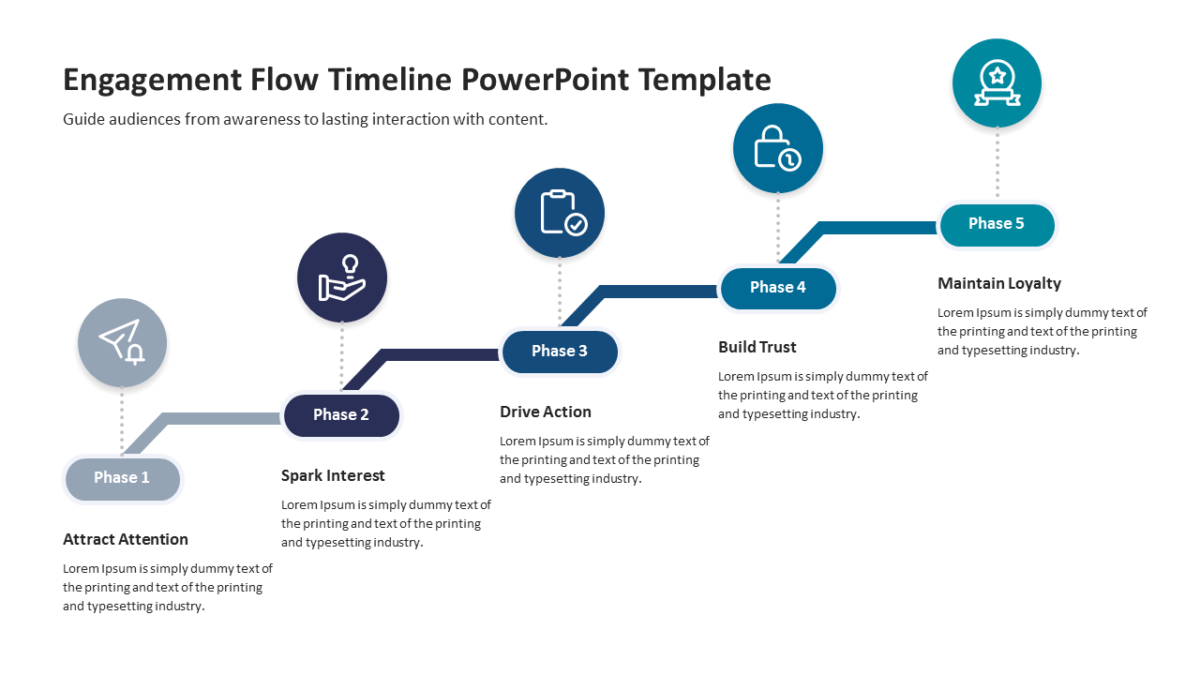
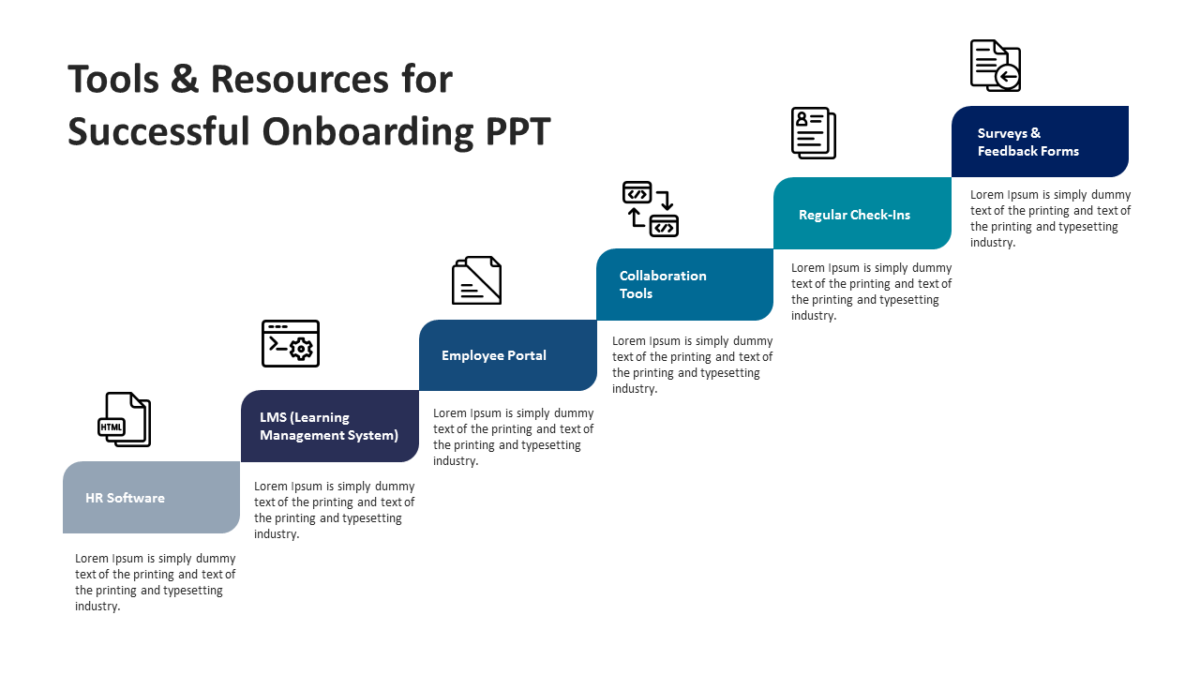
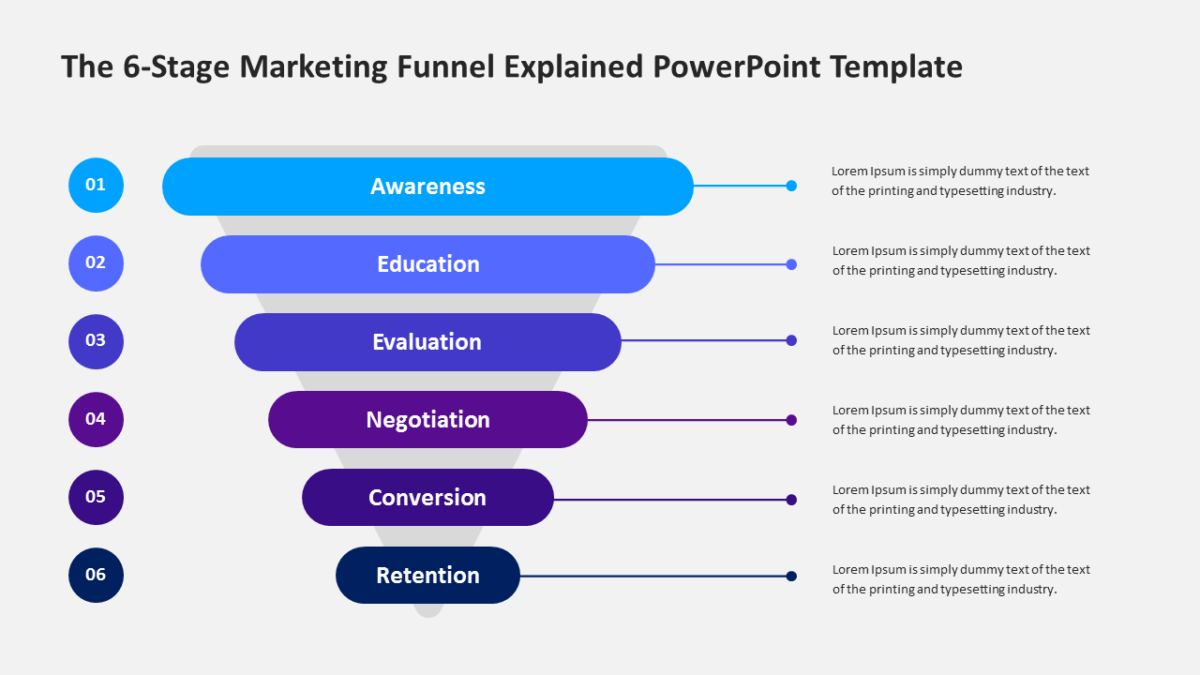
Delivery work fails in predictable places: unclear ownership, invisible dependencies, and a plan nobody remembers past the kickoff. A slide that holds the whole shape in one view is how teams stay aligned between status meetings.
What’s on the slide
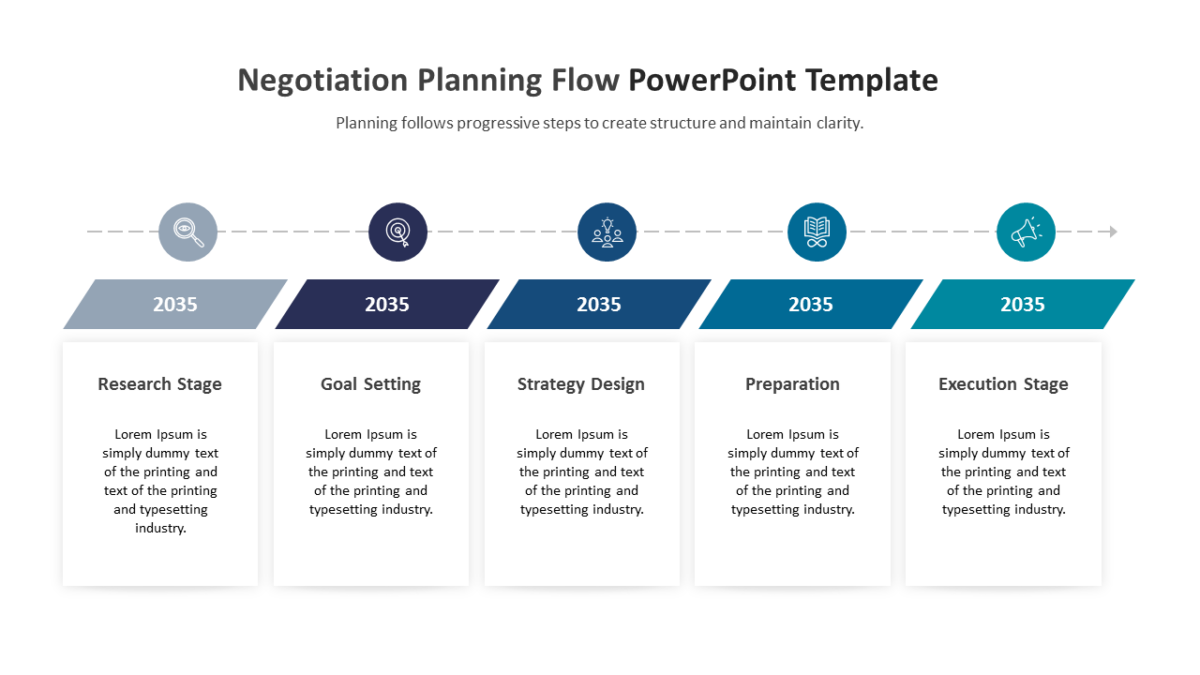
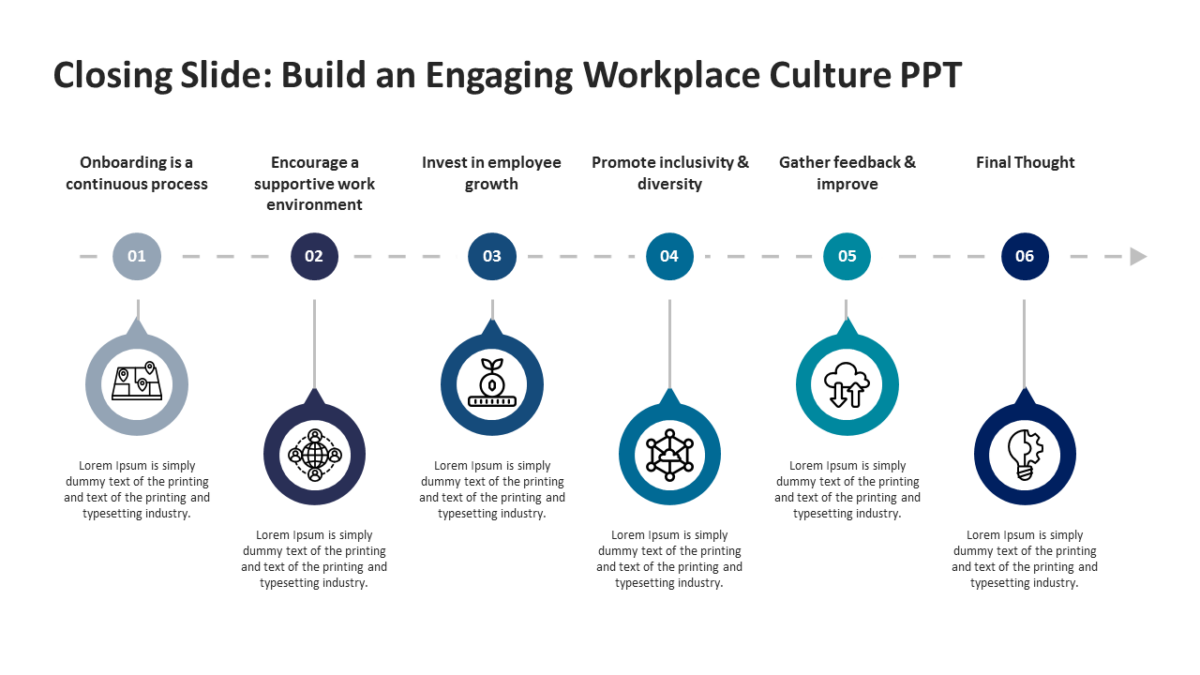
- A horizontal timeline axis with 10 marked points
- Date or period labels on every marker
- A heading and note field per milestone
- Icon slots at each point on the track
Every element is a native PowerPoint shape, so colors, icons and copy are all yours to change. Sized 16:9, and it opens cleanly in Google Slides and Keynote.
Built with PMO teams in mind, but project managers and delivery leads put it to work just as often. Put it wherever you would otherwise say “here is how this played out.” The other project management templates handle the same job at different scales.