3D Stacked Column Chart PowerPoint Template.pptx
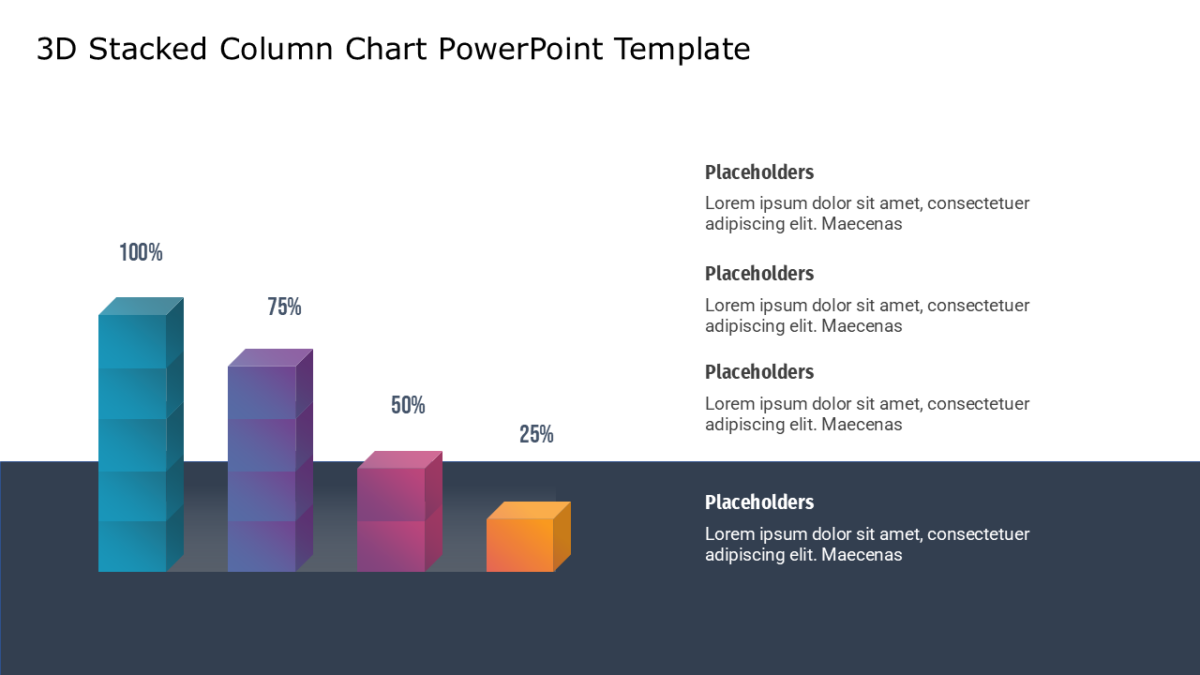
The 3D Stacked Column Chart PowerPoint Template lets a number argue for itself by standing next to another one.
Finance audiences are the most skeptical in any room and the quickest to spot a slide that hides something. Clean structure signals that the numbers underneath are equally tidy.
What’s on the slide
- A data-driven column chart linked to an editable data sheet
- A legend for multiple series
- Space above the tallest bar for an annotation
- Category labels along the axis
Fills, labels, icons and body copy are all editable. It ships at 16:9 and survives the trip into Google Slides or Keynote without breaking.
The usual audience is commercial finance, with finance managers and financial analysts not far behind. Place it before the interpretation slide rather than after. Pair it with anything from the bar chart templates to keep a deck consistent.