Opportunity Management Flow PowerPoint Infographic
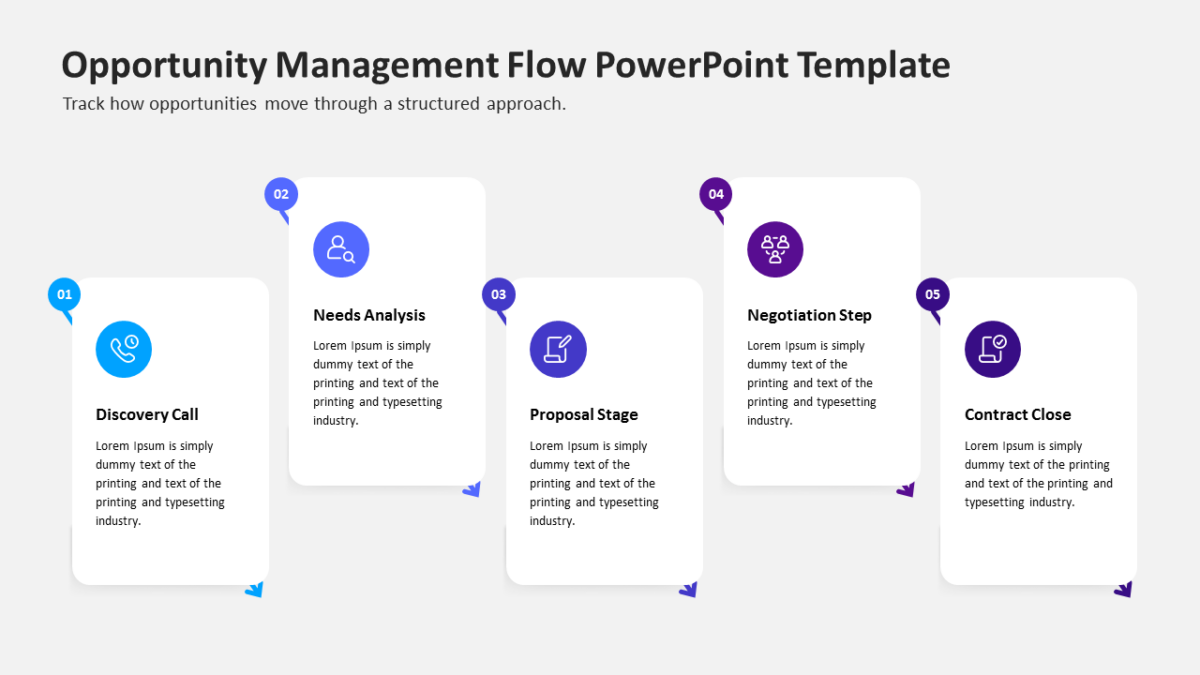
The Opportunity Management Flow PowerPoint Infographic exists for the moment when “here is how it works” needs more than a paragraph.
Most pipeline problems are process problems that nobody drew. Once the stages are on a slide, the stage where deals actually stall becomes obvious.
What’s on the slide
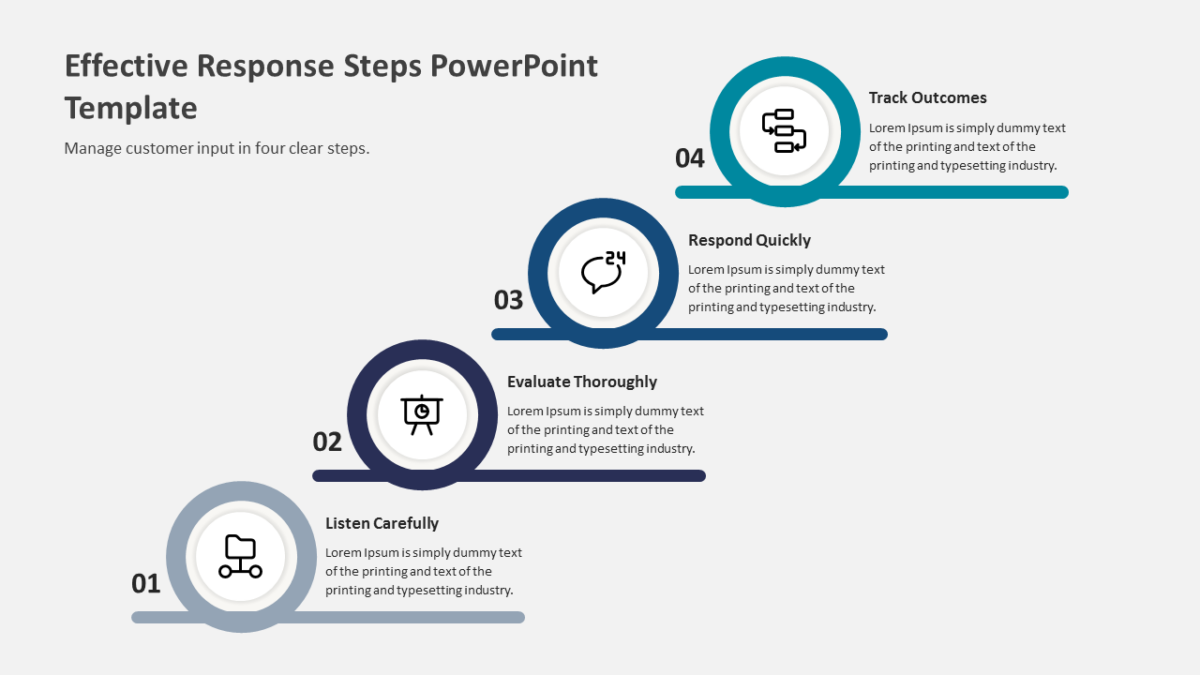
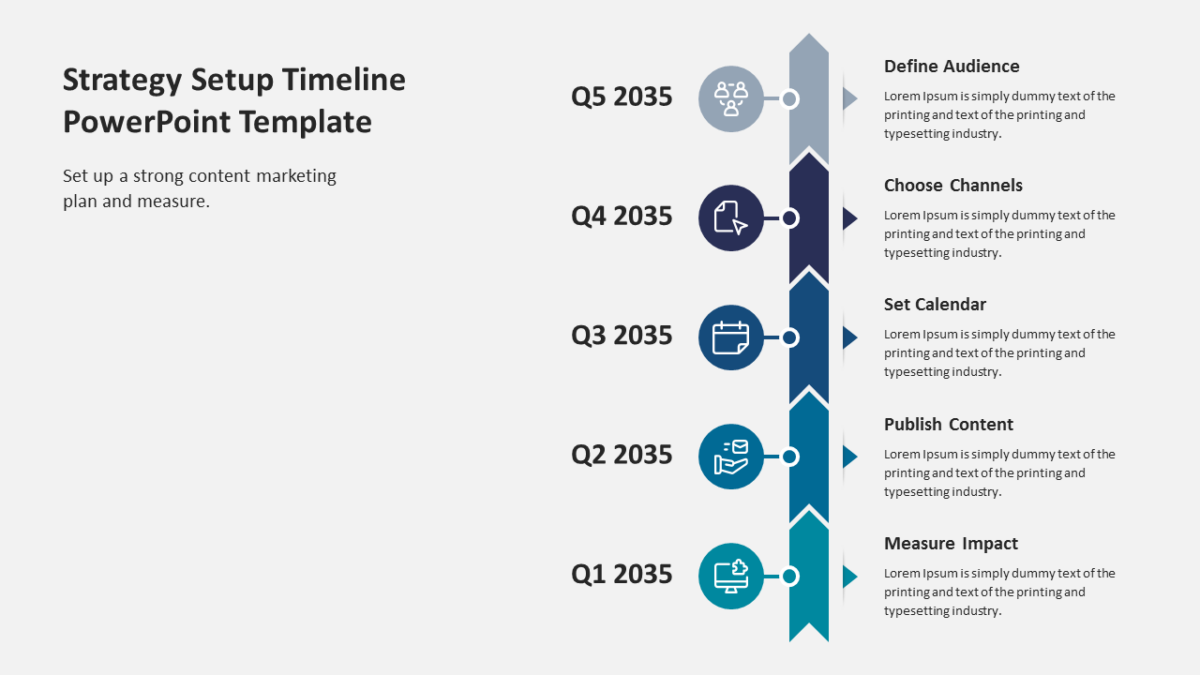
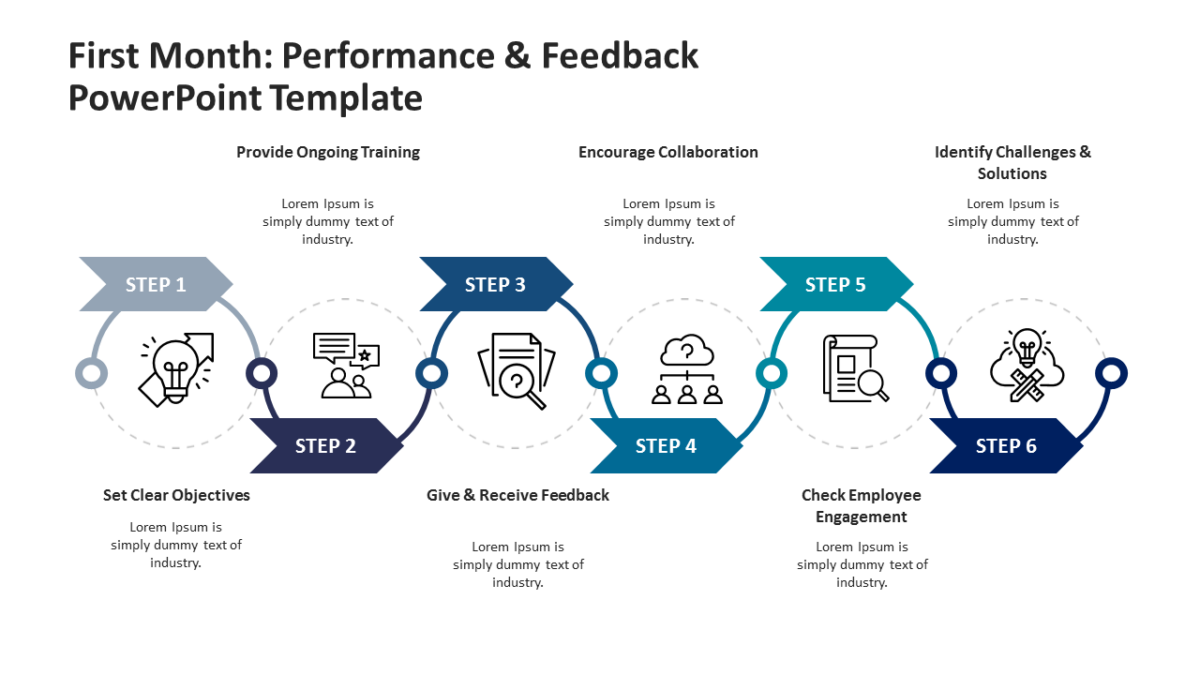
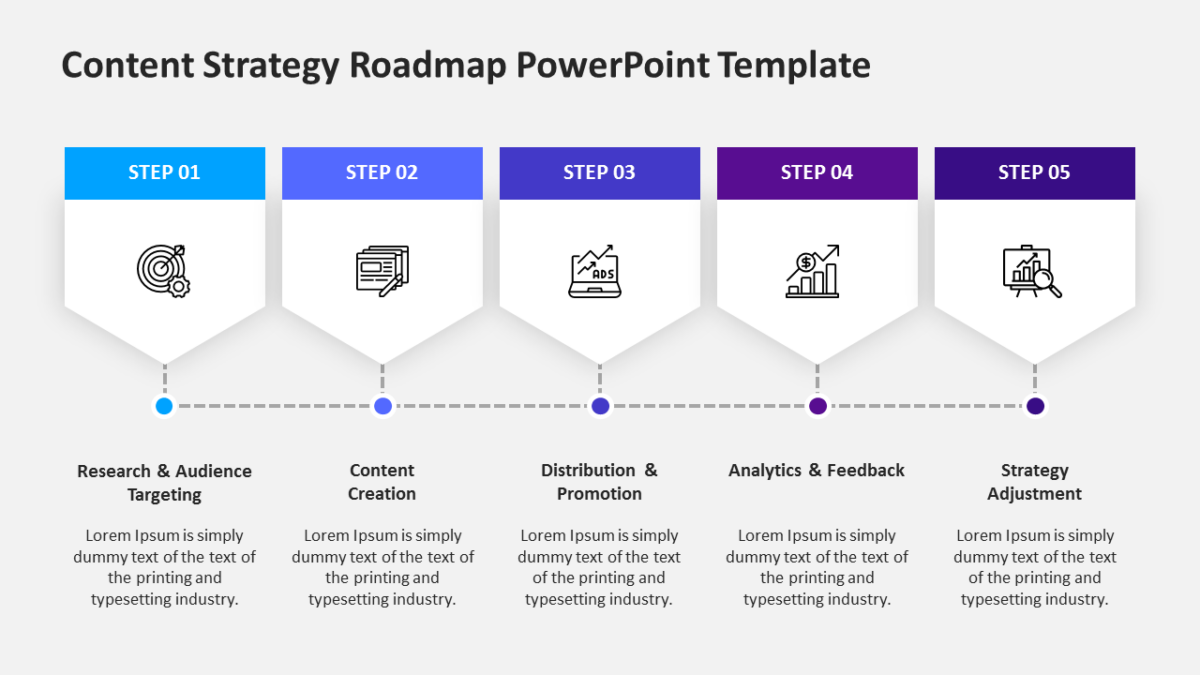
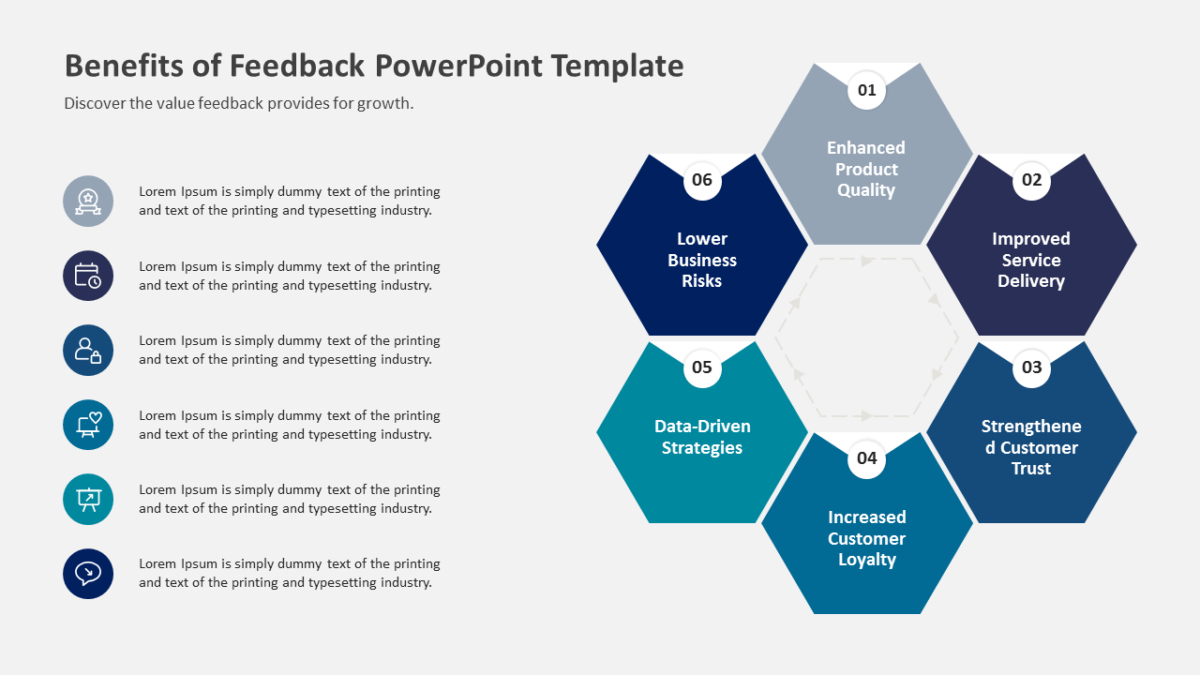
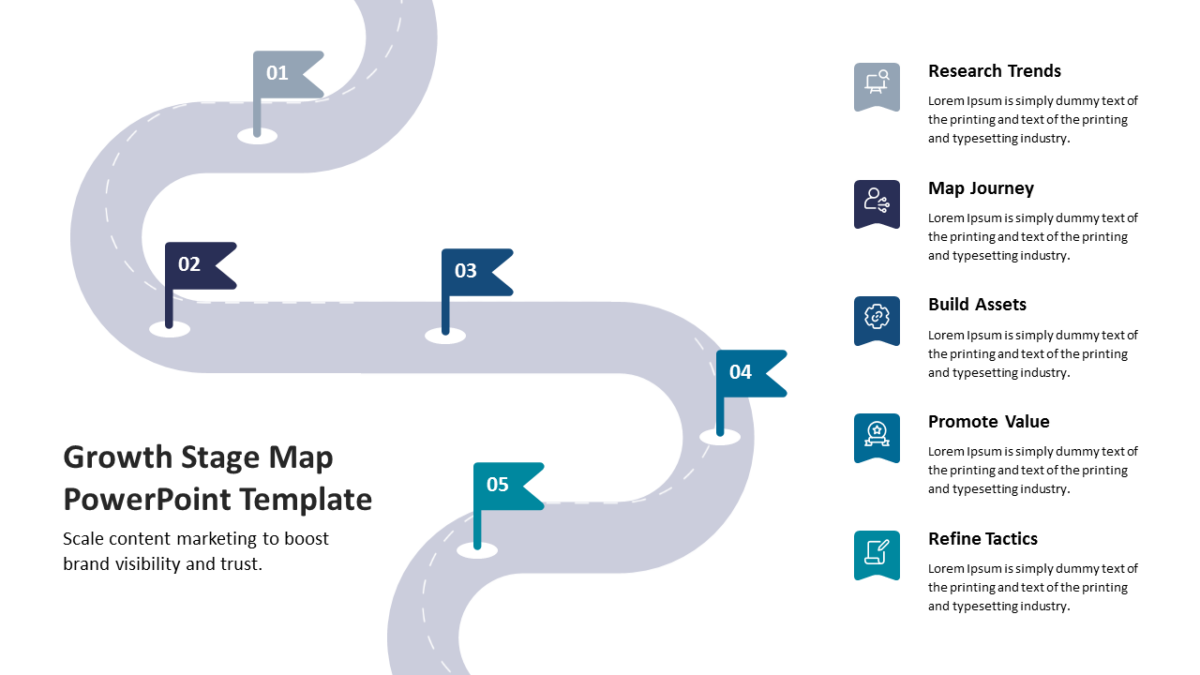
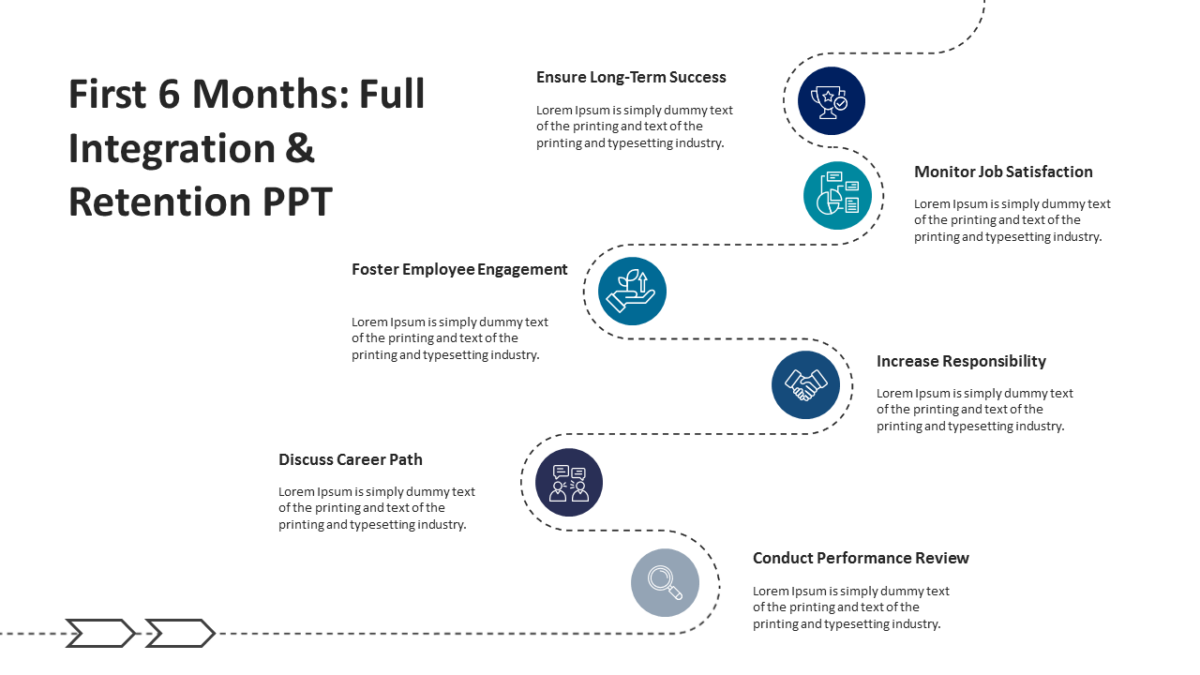
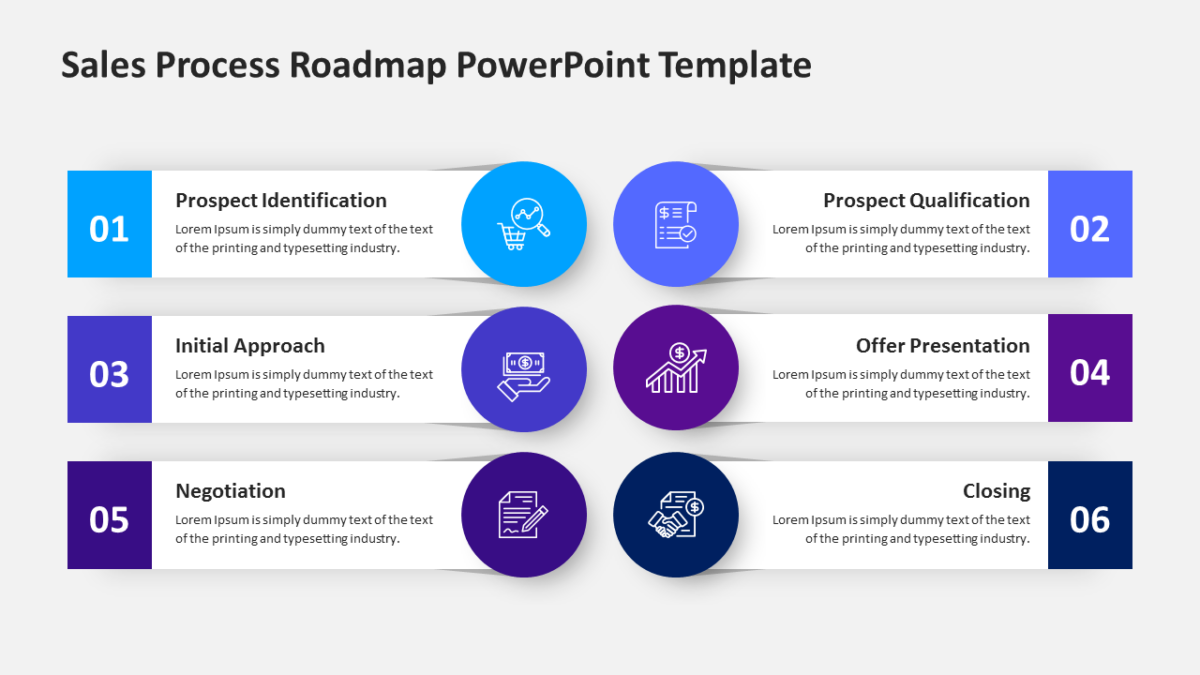
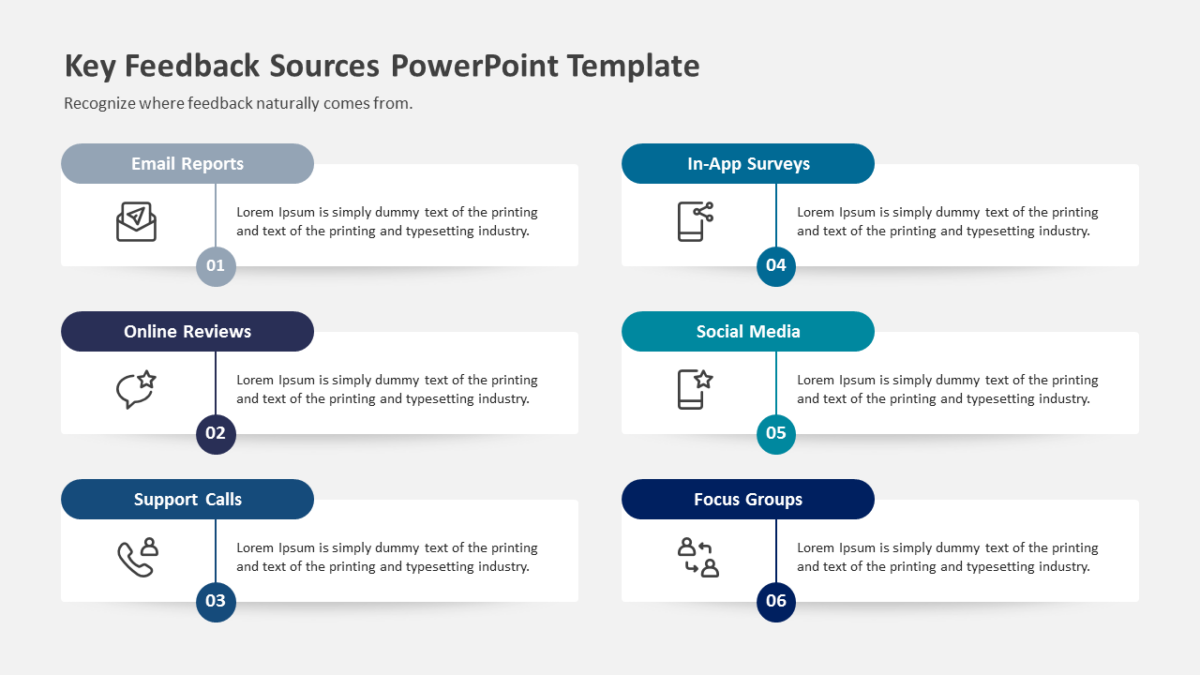
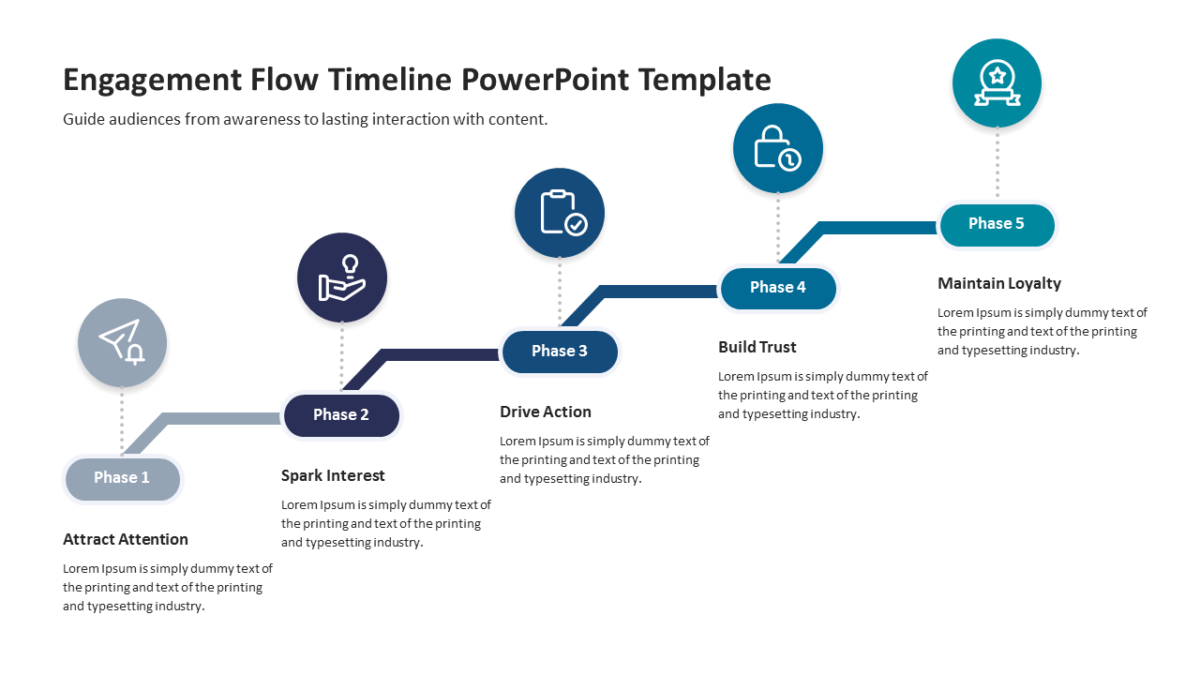
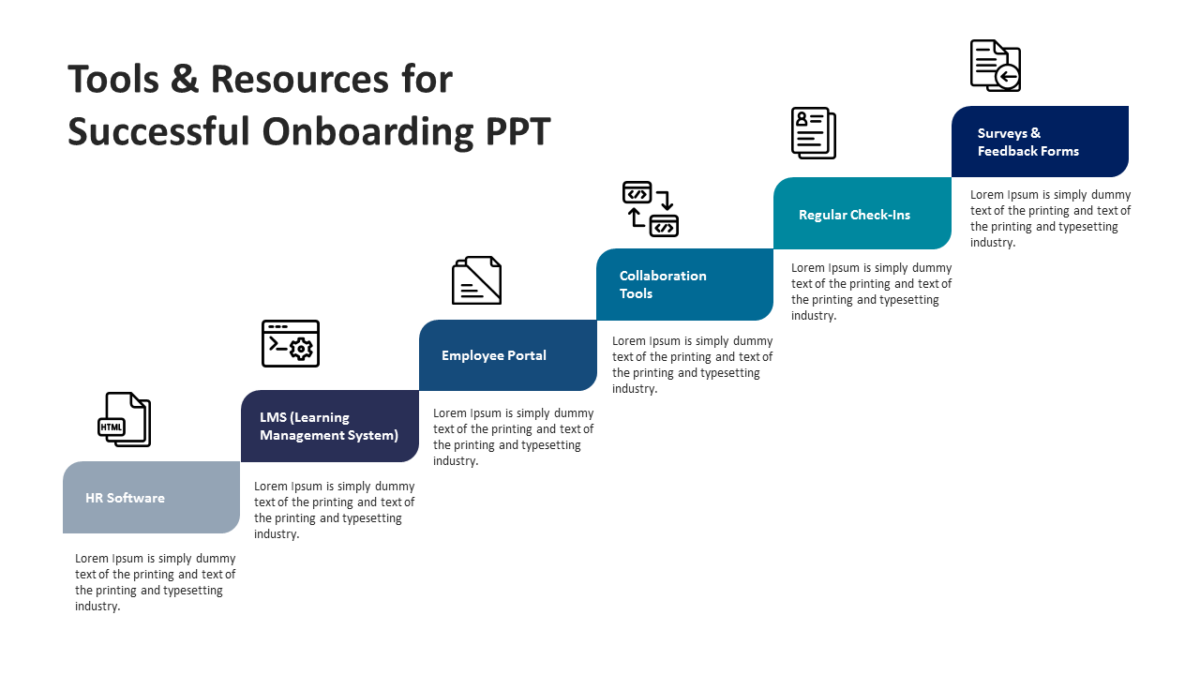
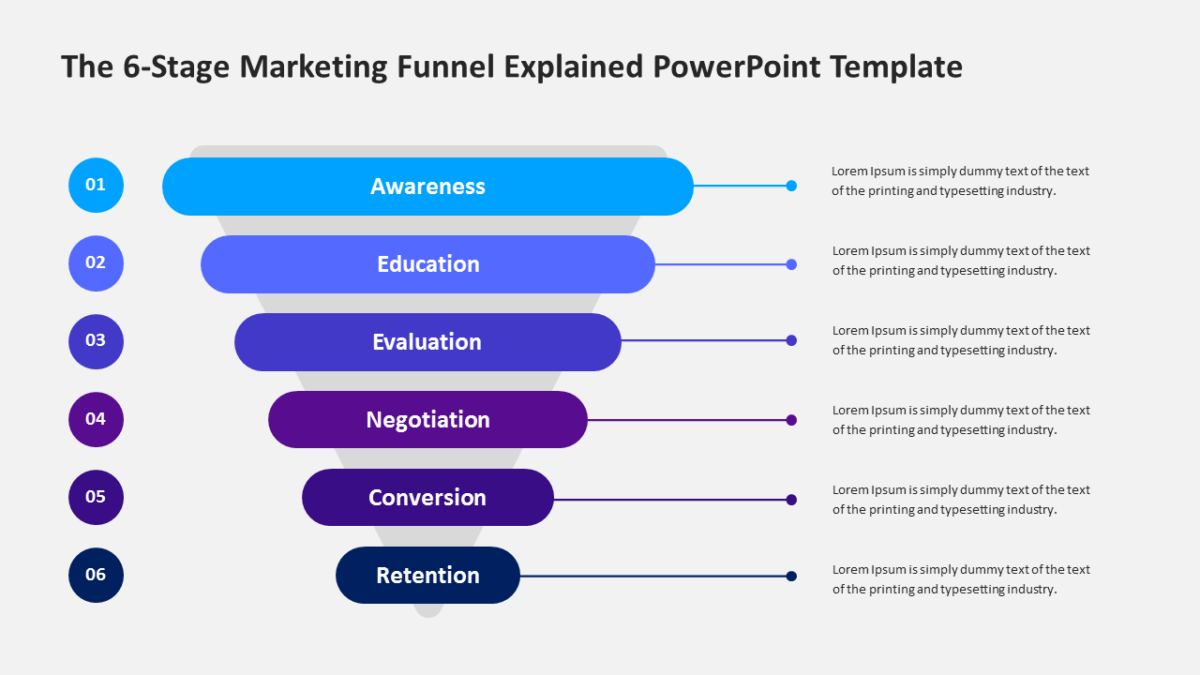
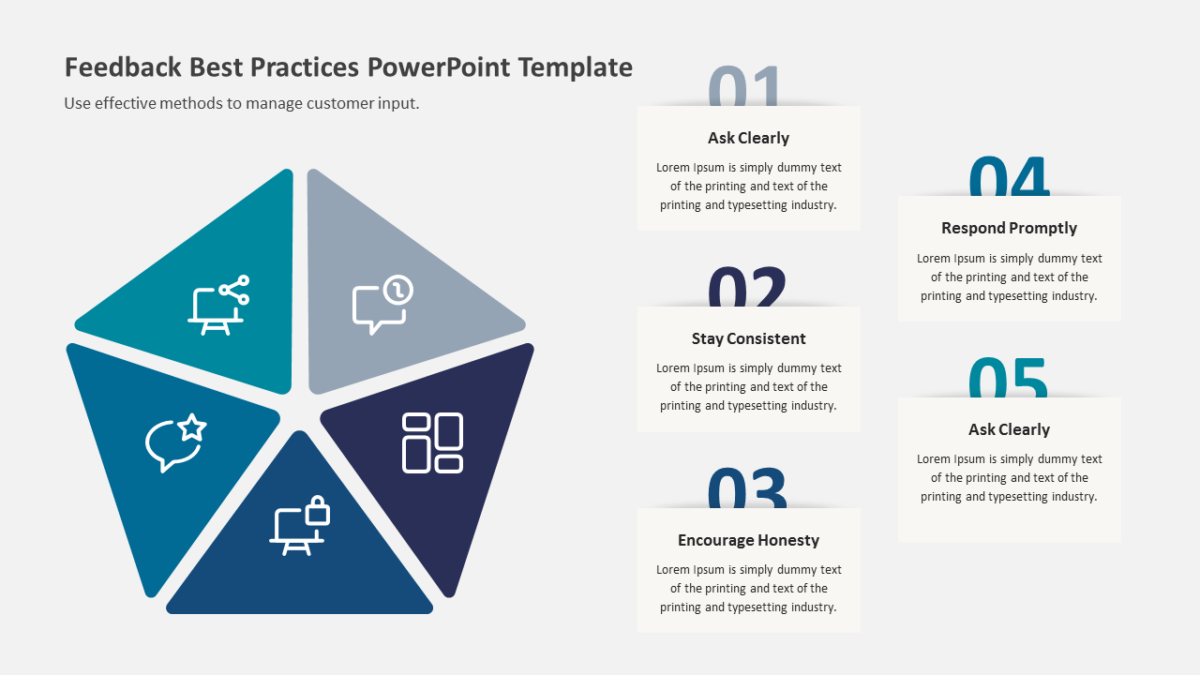
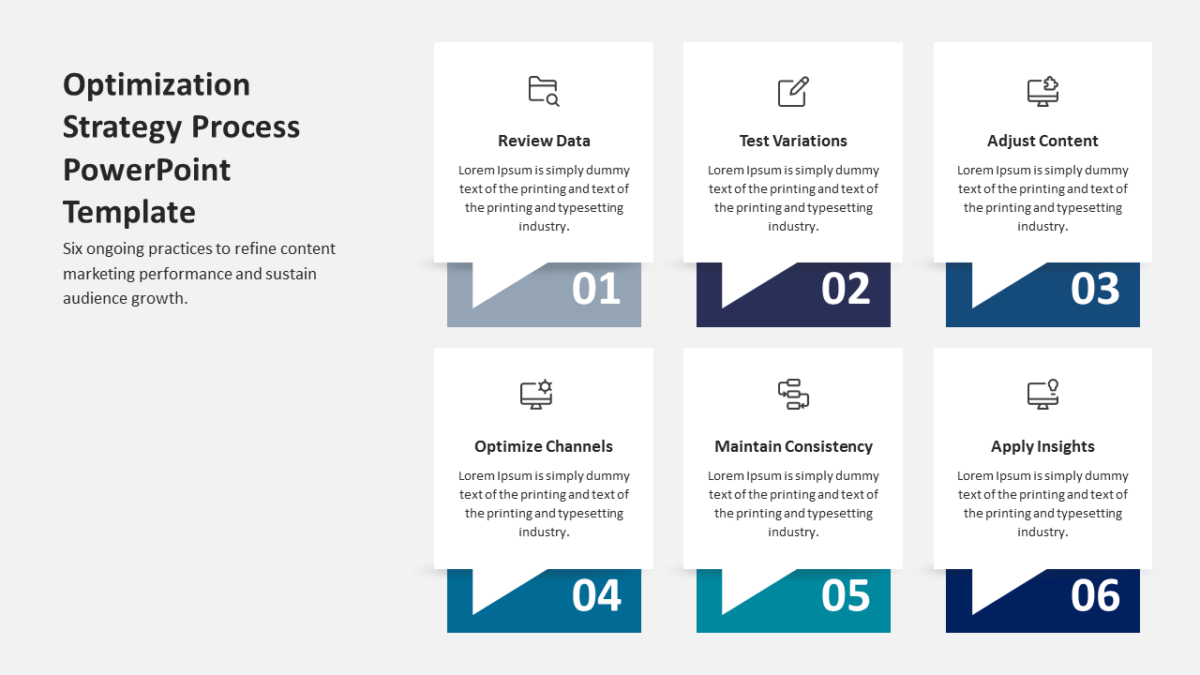
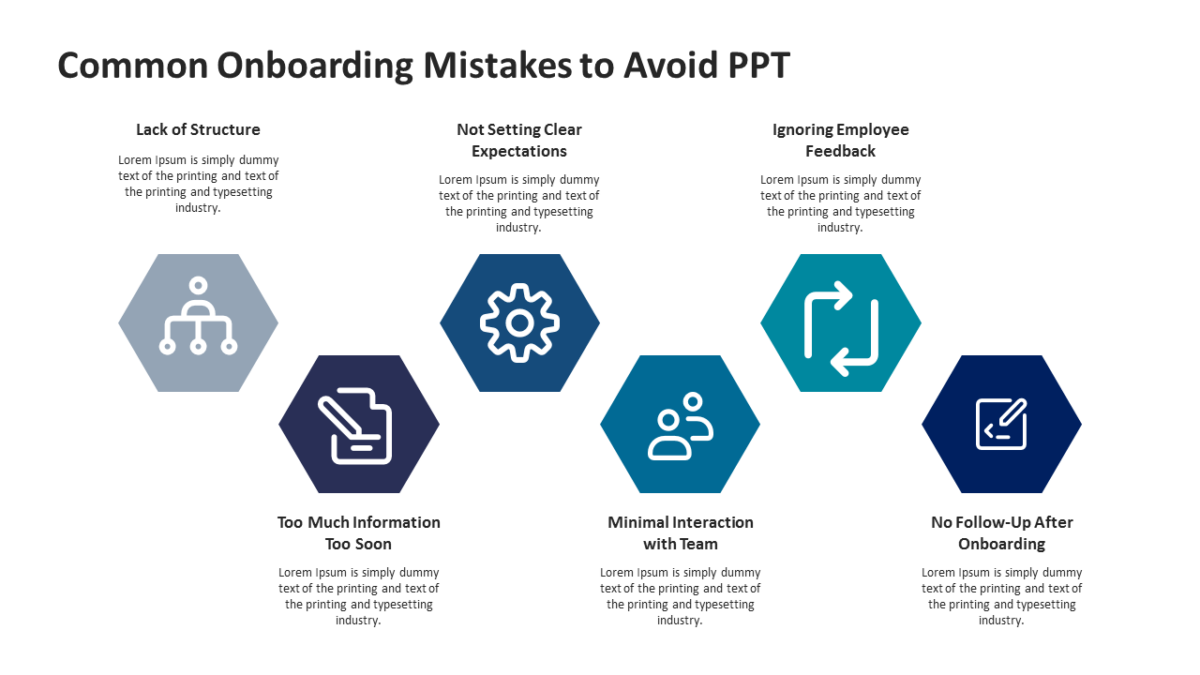
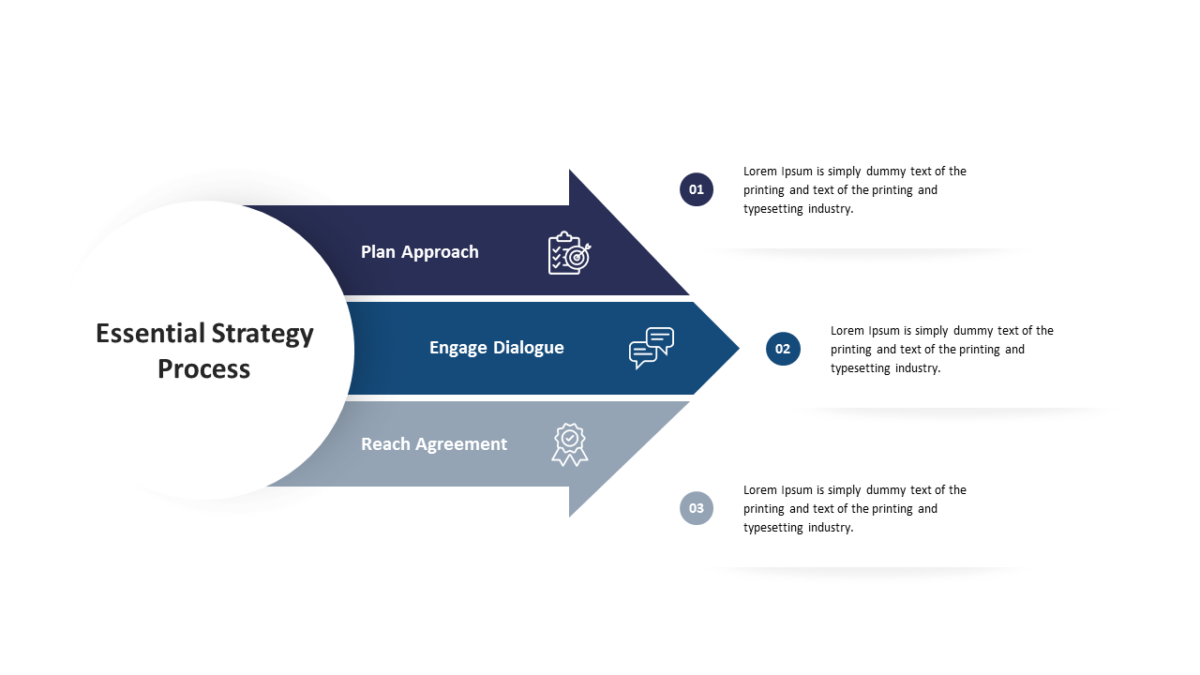
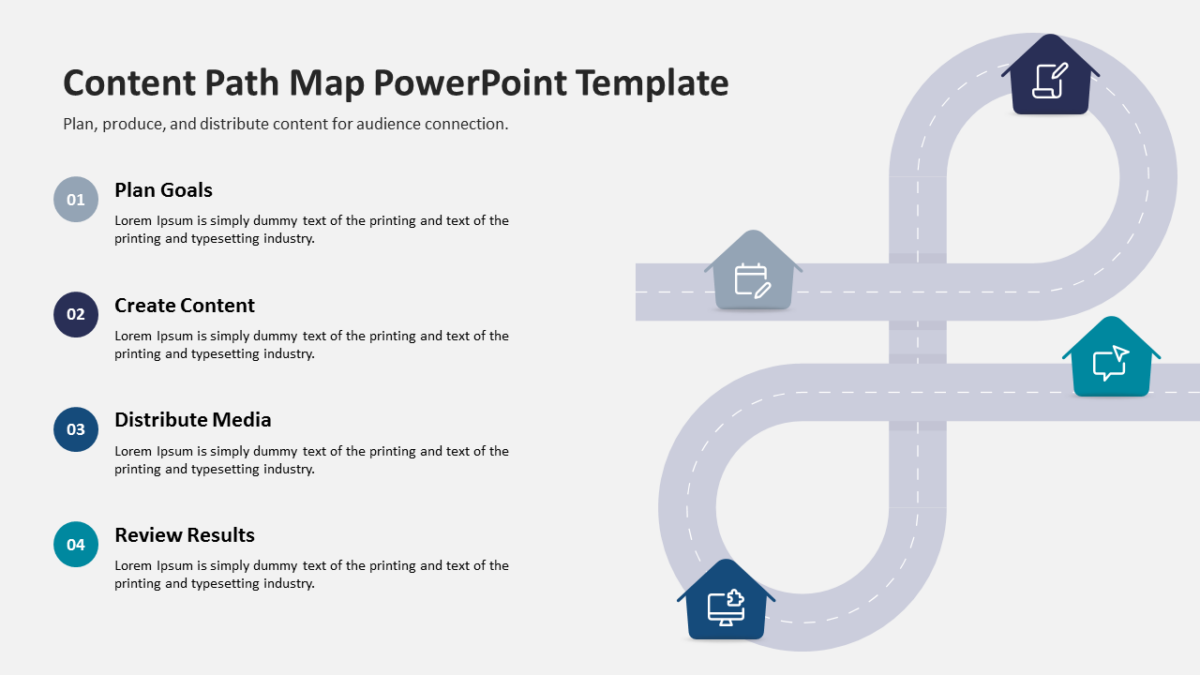
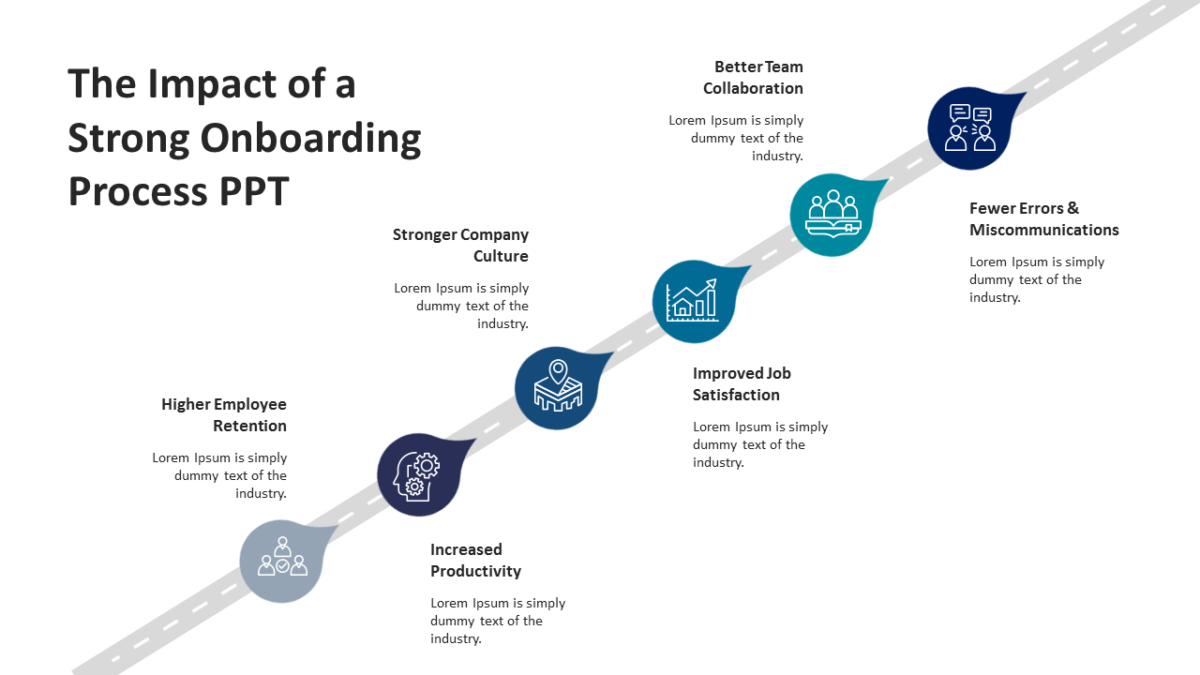
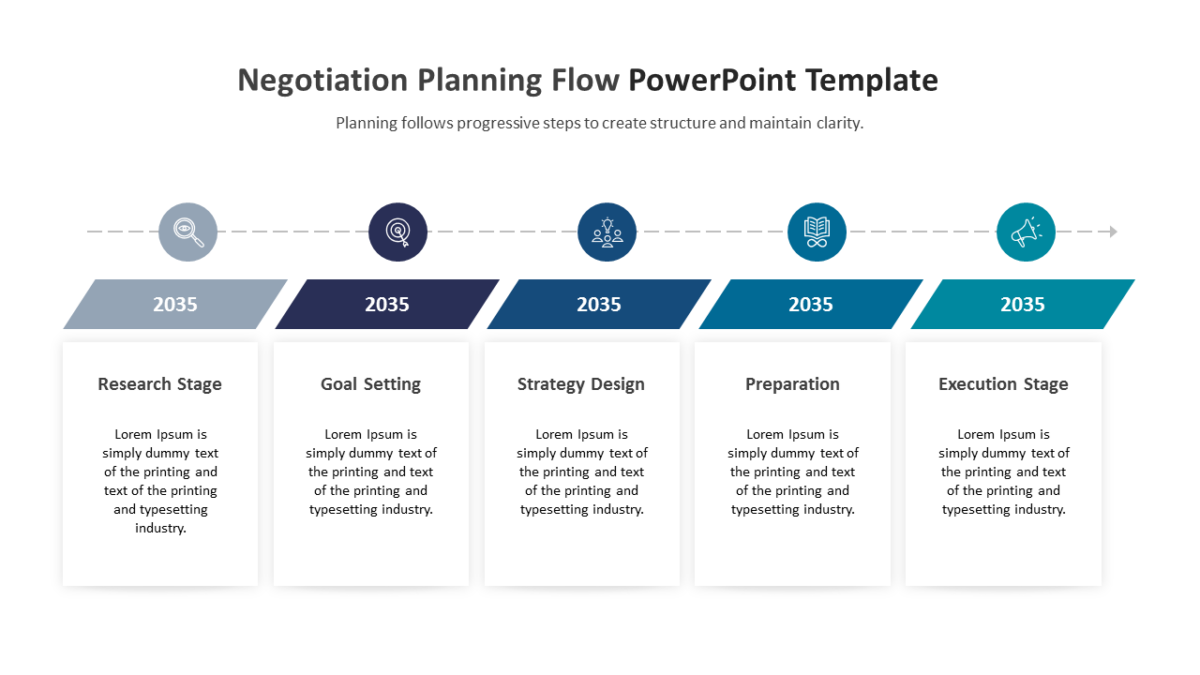
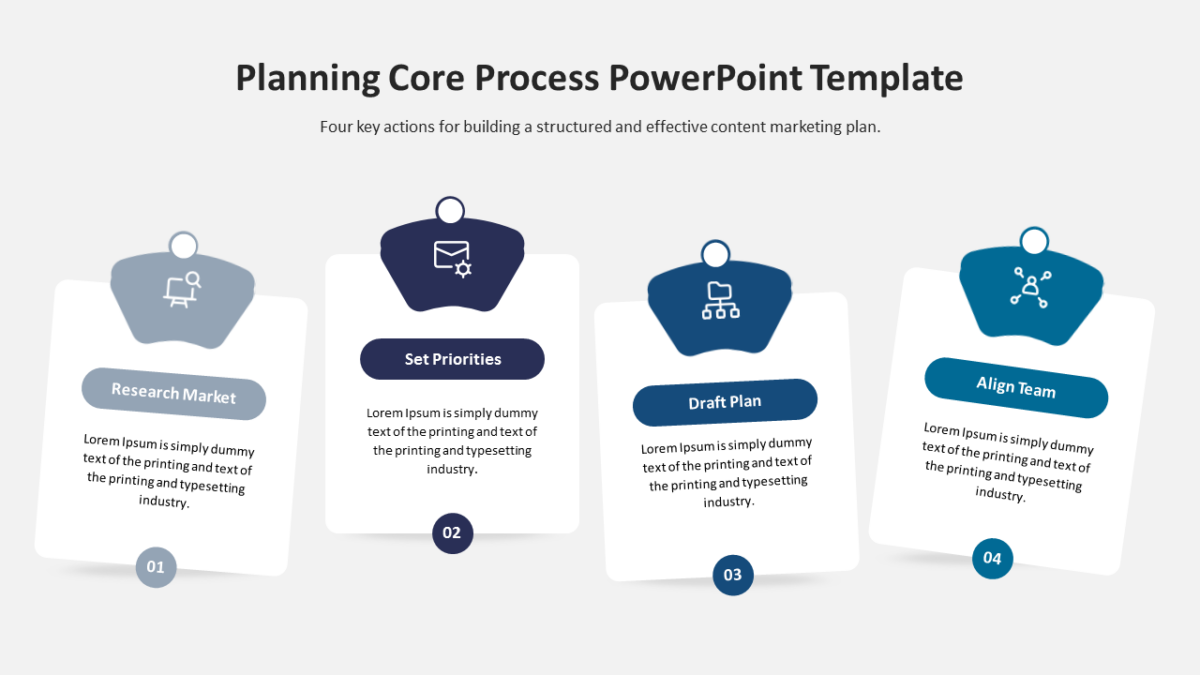
- Connected stages running across the slide, each numbered
- A heading and short description block per step
- Connectors built into the graphic, so the sequence reads at a distance
- Title and subtitle area at the top
Fills, labels, icons and body copy are all editable. It ships at 16:9 and survives the trip into Google Slides or Keynote without breaking.
Built with sales enablement in mind, but account executives and revenue leaders put it to work just as often. Place it after your framing slide and before any results. For a different treatment of the same idea, the rest of the business strategy templates are worth a look.