User Experience Journey Infographic Slides
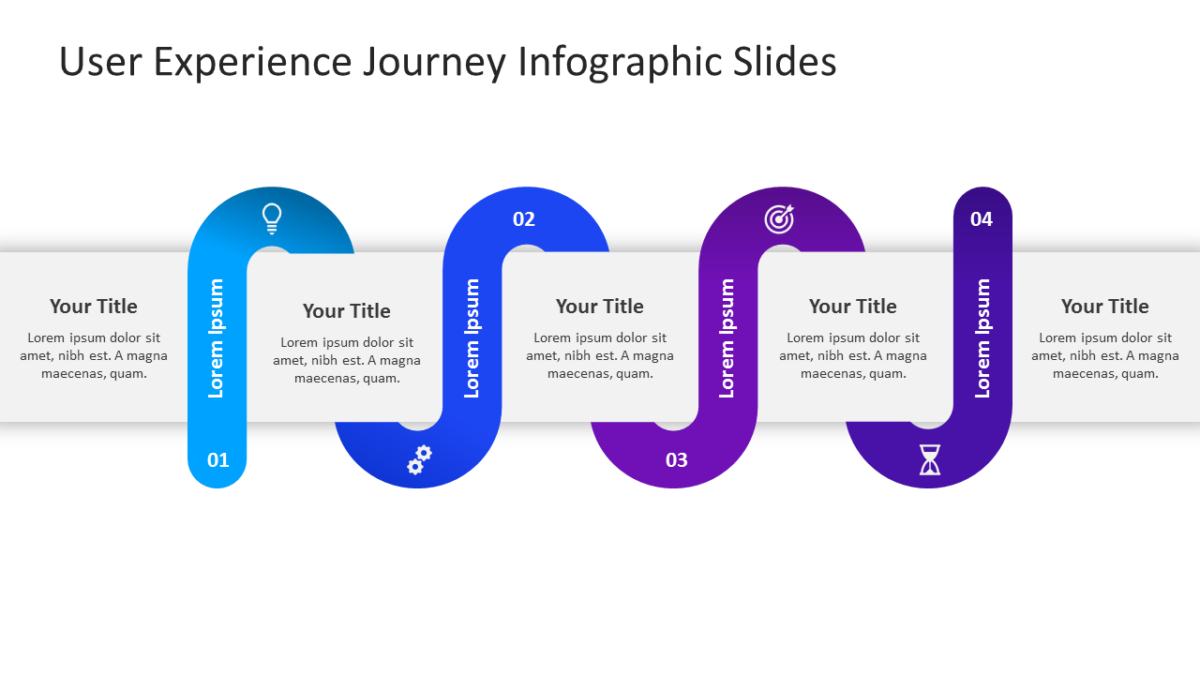
Plans get approved when people can see where they lead. The User Experience Journey Infographic Slides shows the destination.
Roadmaps are read by engineering, sales and leadership, each looking for something different. A clear visual is what lets one slide serve all three.
What’s on the slide
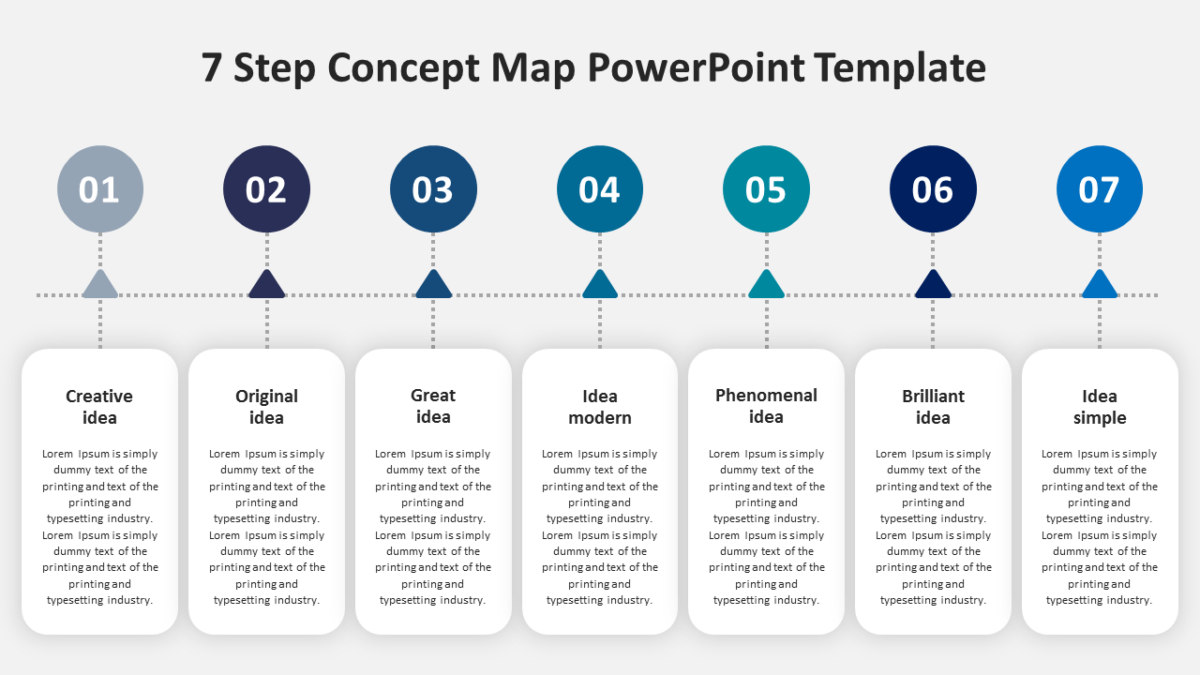
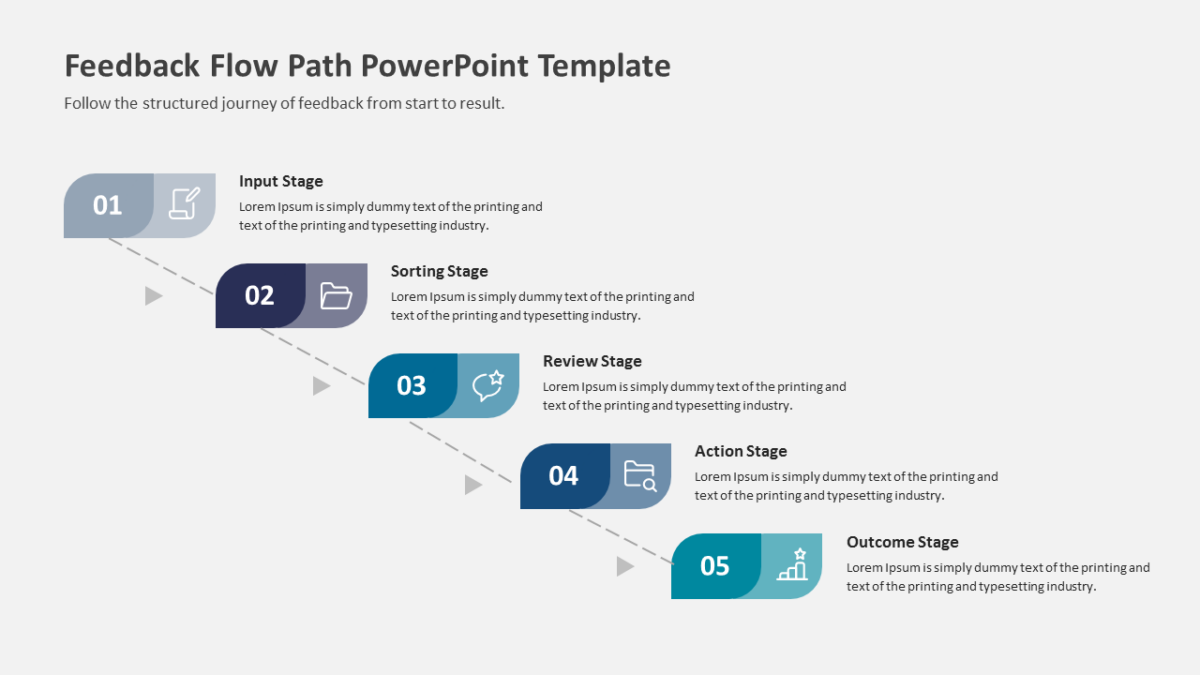
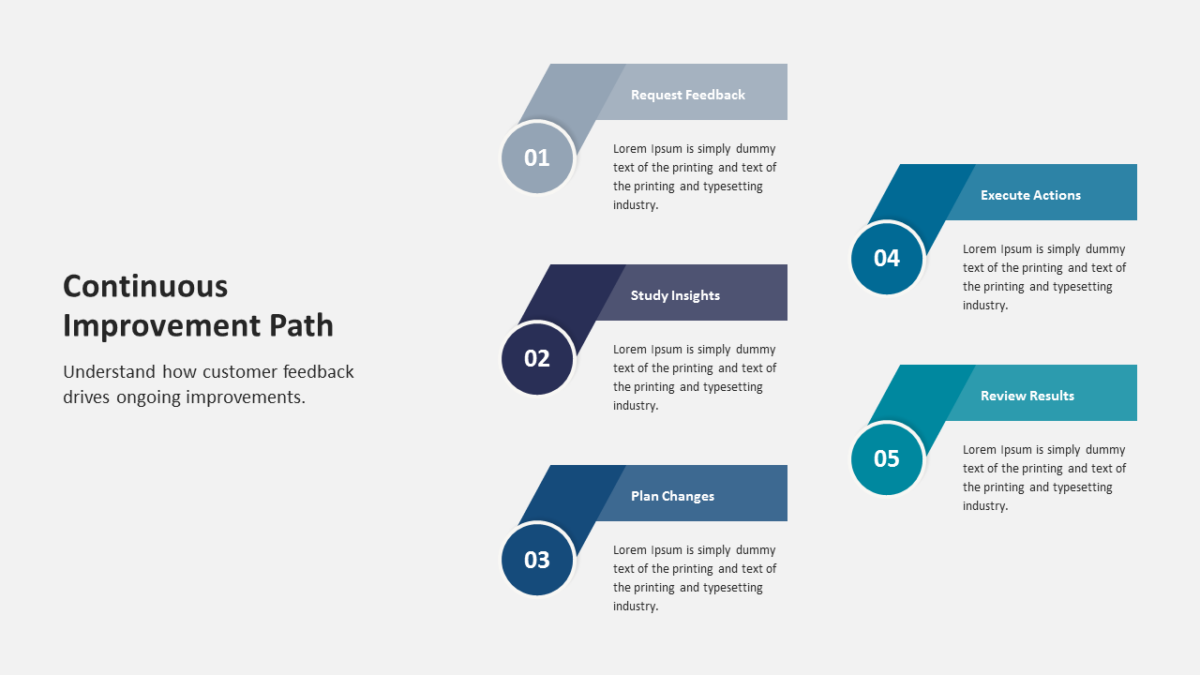
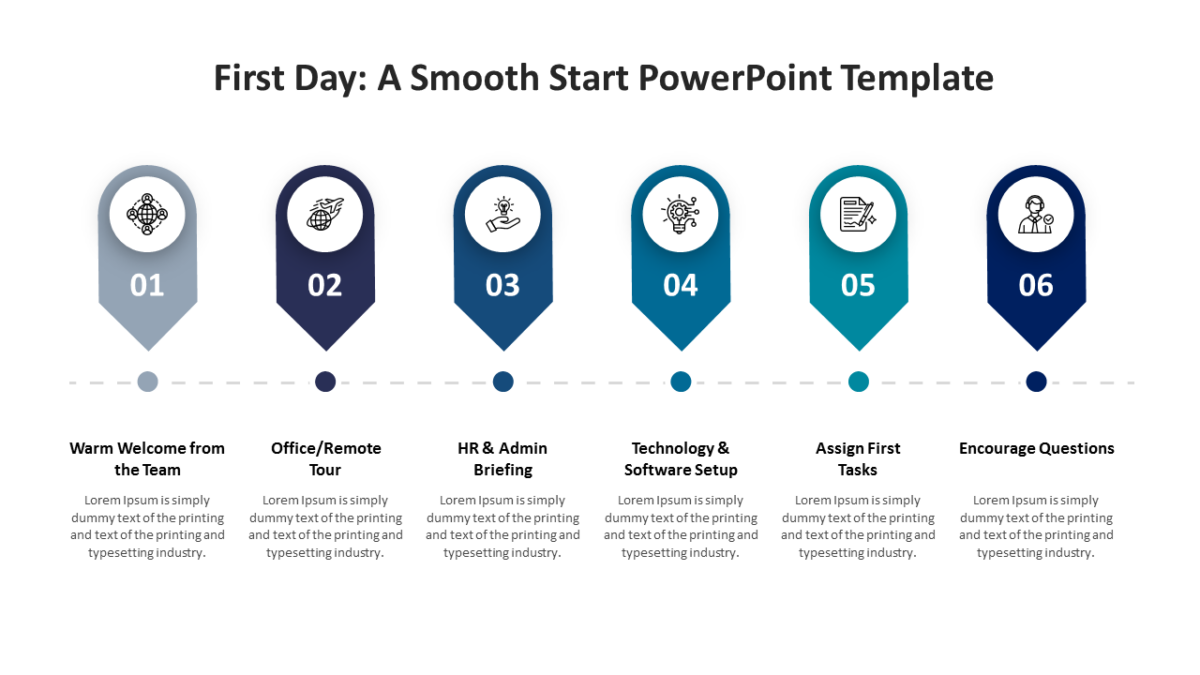
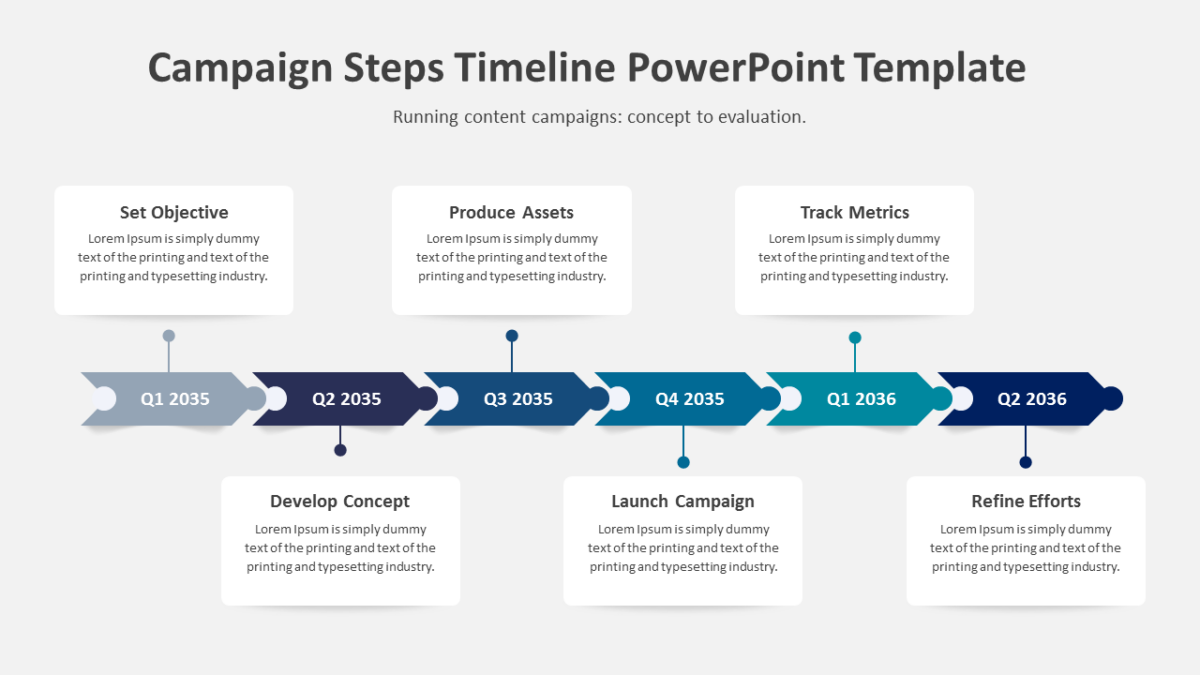
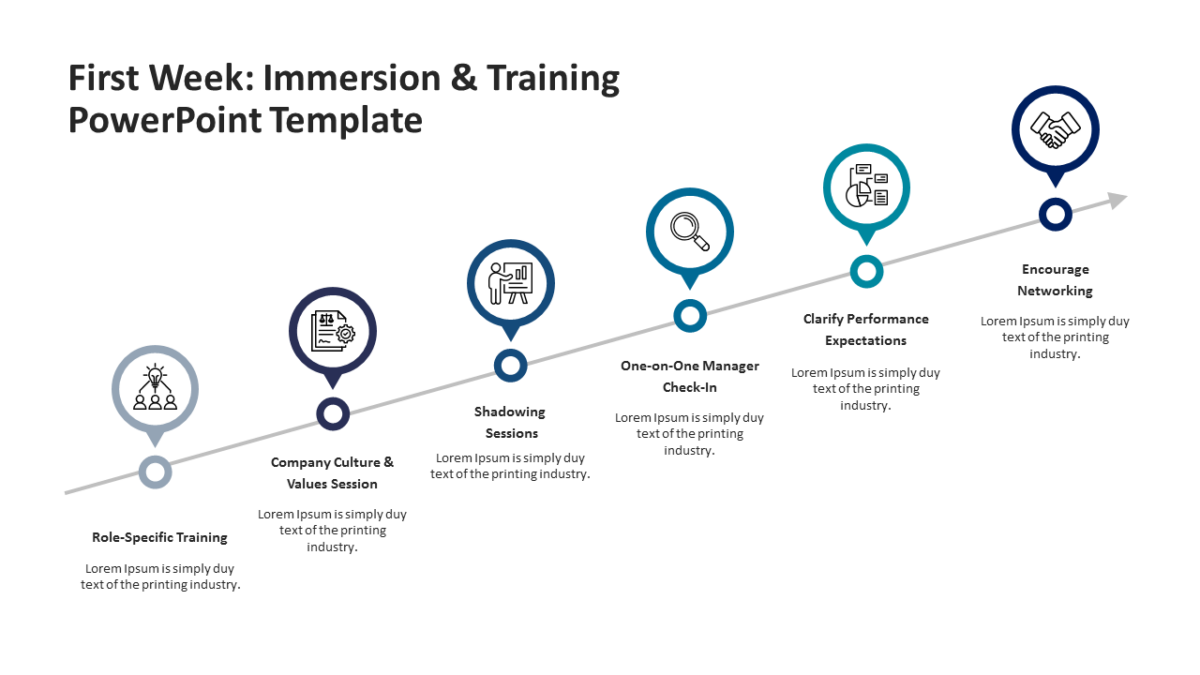
- A path running across the slide with marked stops
- Title area with room for a timeframe
- Directional flow built into the route itself
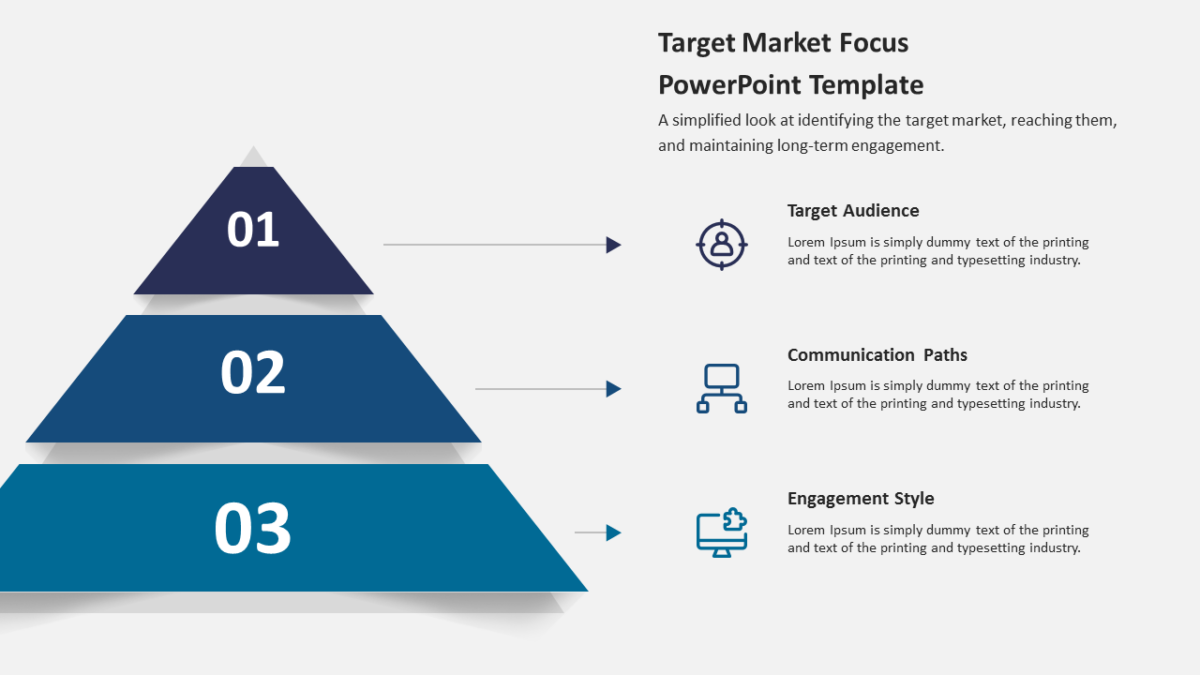
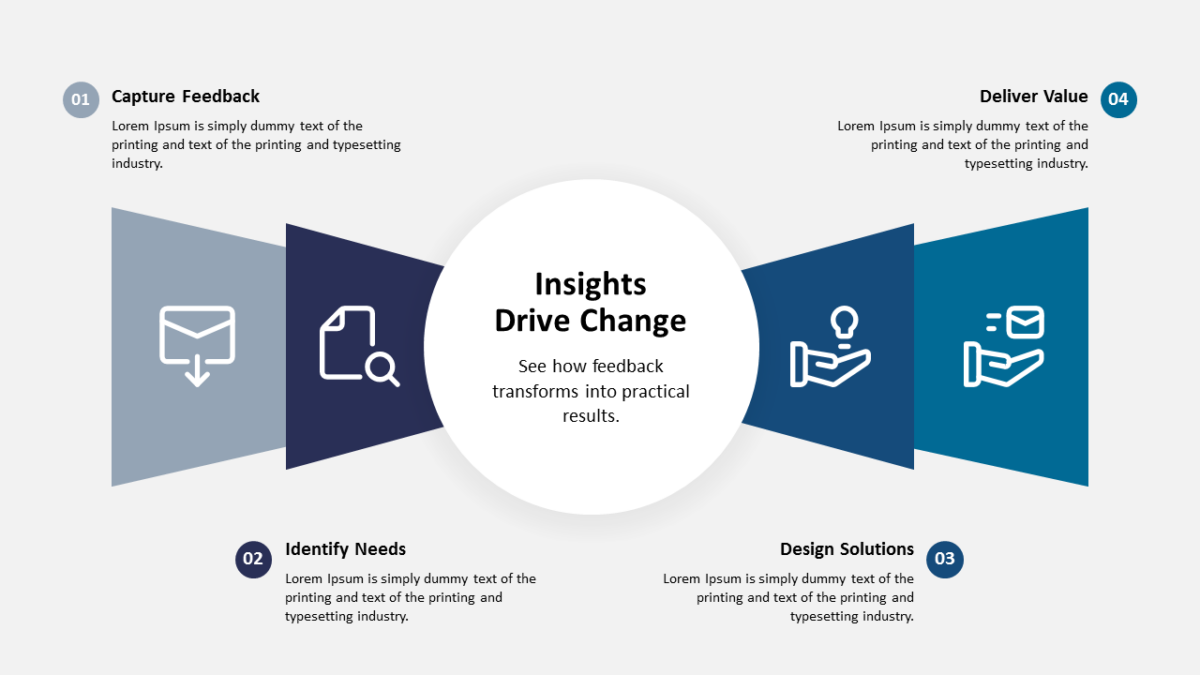
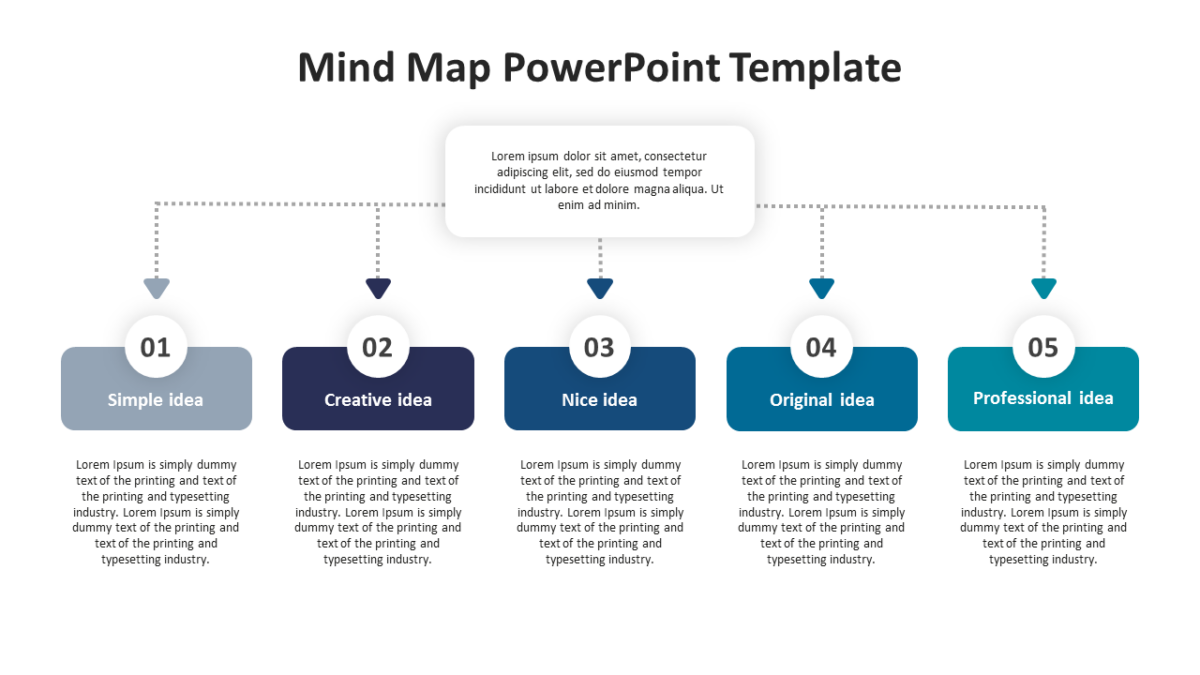
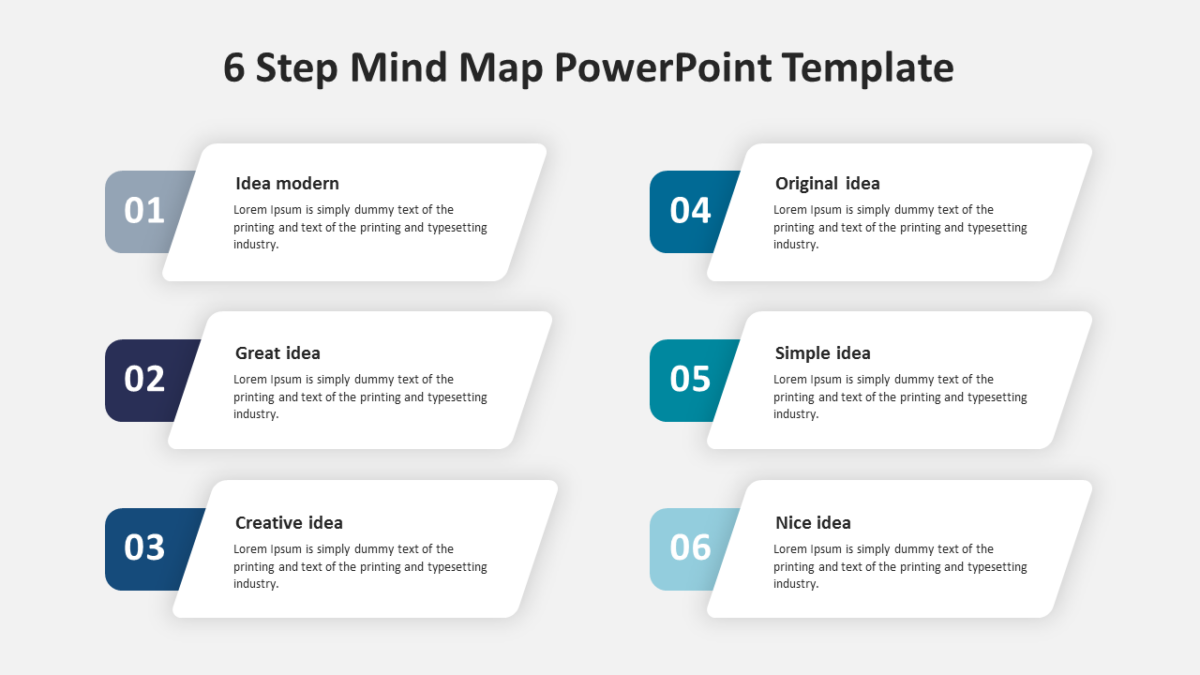
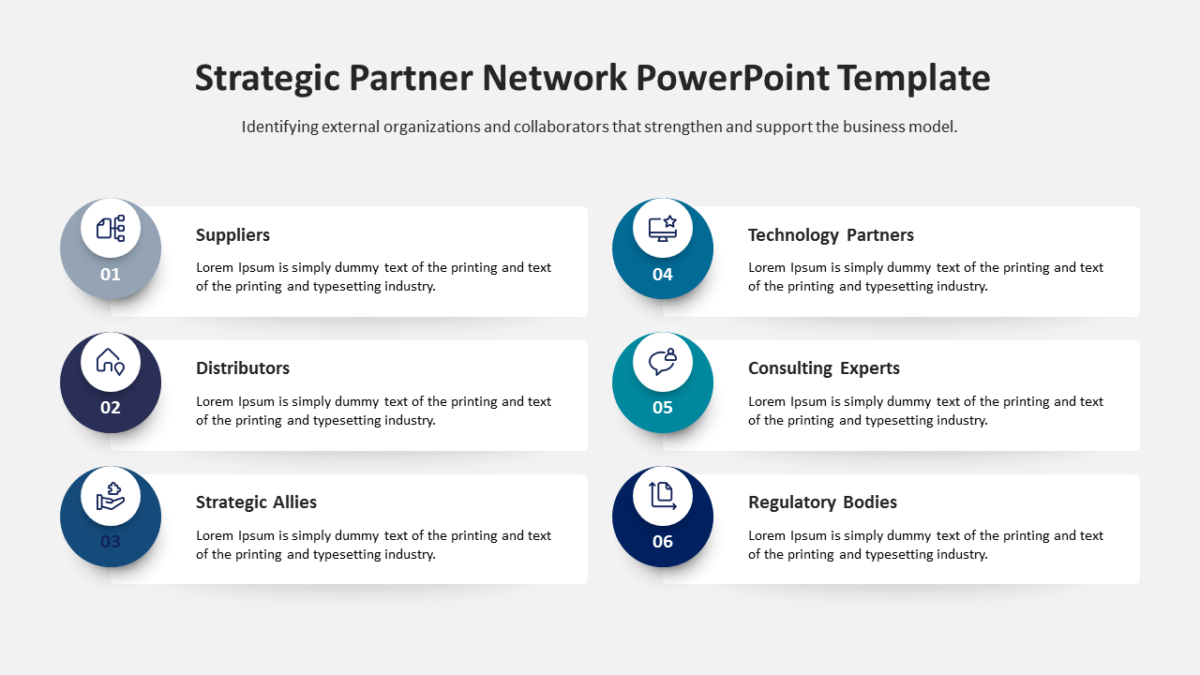
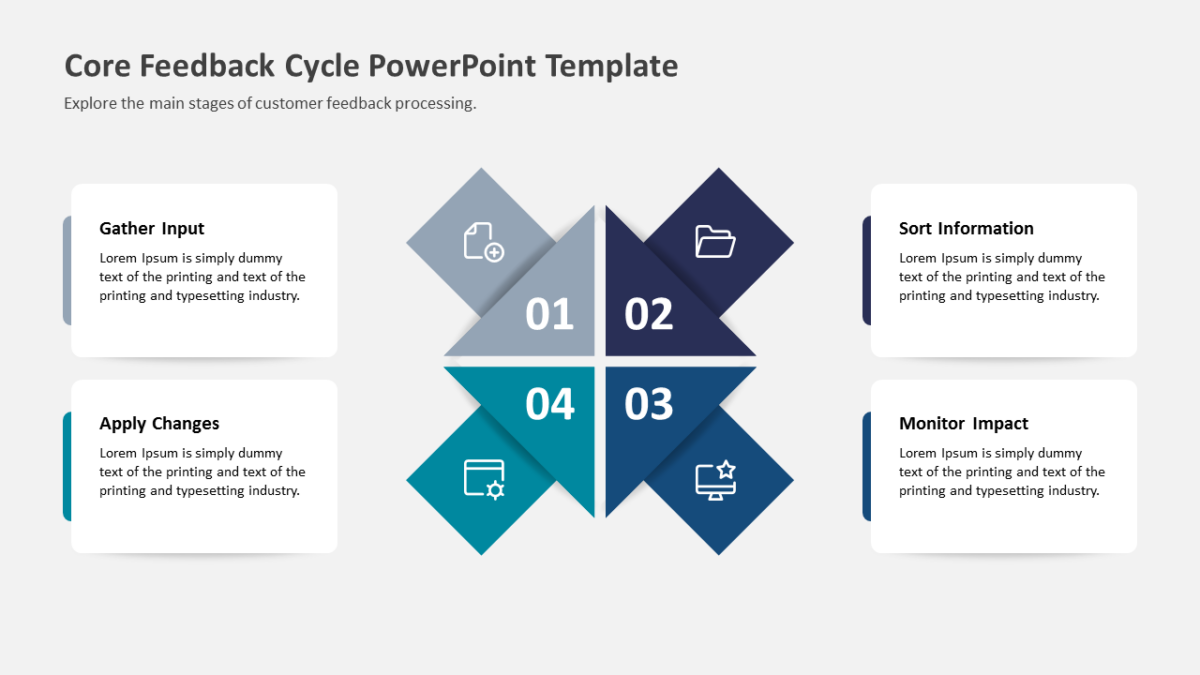
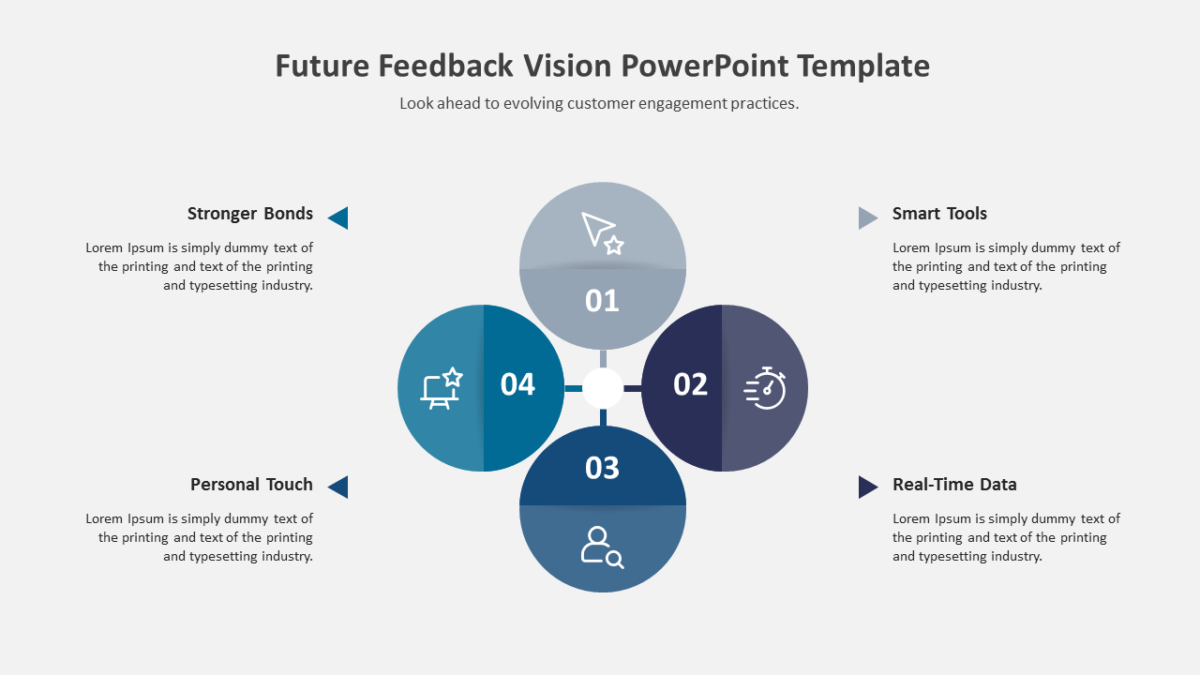
- Icon markers and a description panel per stage
Drop in your own copy, swap the palette, resize what you need. Everything is a vector shape. 16:9, and Google Slides and Keynote handle it without issue.
Built with design leads in mind, but product marketing and founders put it to work just as often. It reads best late, where the deck turns from analysis to intent. Browse the planning templates to compare a few layouts before committing.