Matrix Infographic PowerPoint Slide
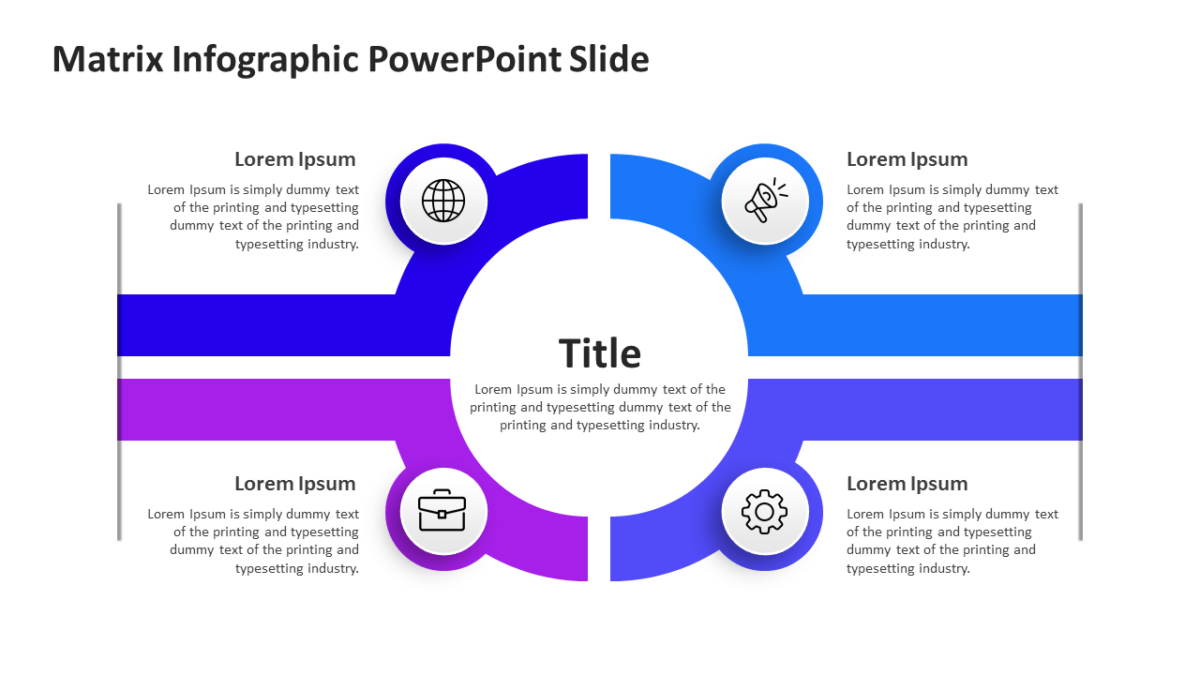
Two variables, four outcomes, one slide. The Matrix Infographic PowerPoint Slide is how a trade-off becomes arguable.
Alignment is a visual problem before it is a communication problem. People agree faster once they are looking at the same diagram.
What’s on the slide
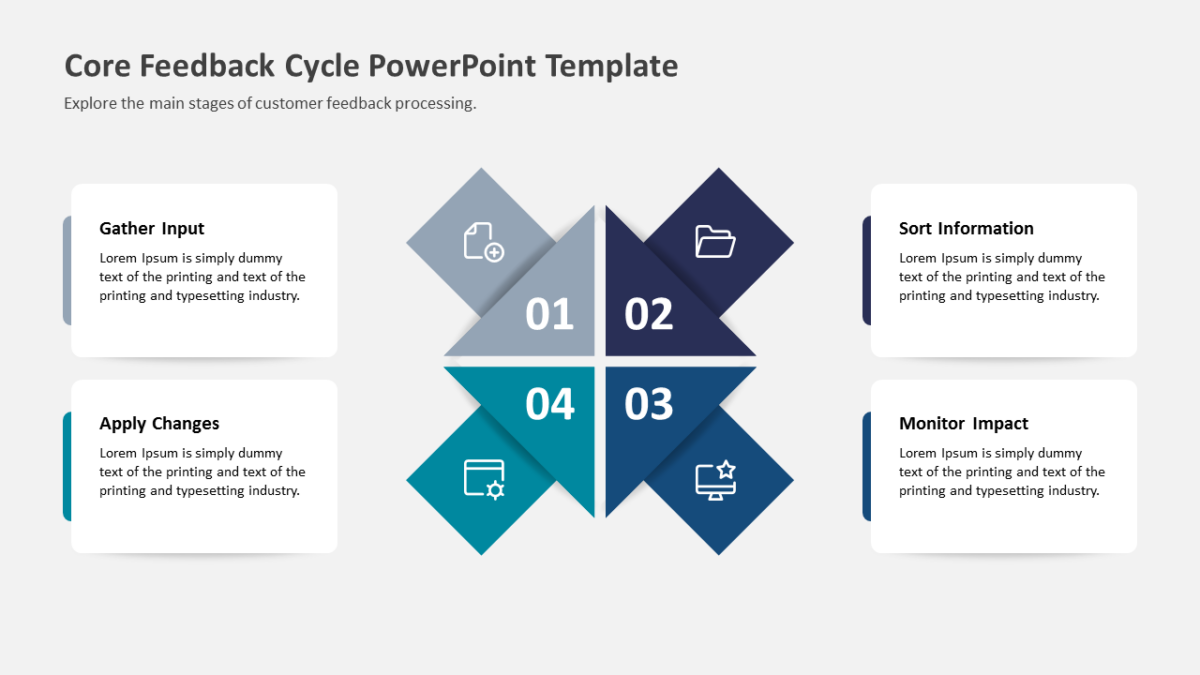
- A four-quadrant grid with labeled axes
- Axis labels on both the horizontal and vertical
- A heading and text area inside every cell
- Distinct fills per quadrant
- Room for items or icons within each box
Drop in your own copy, swap the palette, resize what you need. Everything is a vector shape. 16:9, and Google Slides and Keynote handle it without issue.
The usual audience is corporate development, with strategy leads and management consultants not far behind. It belongs in the analysis section, immediately before recommendations. If the count is wrong for your content, the other comparison templates cover the same ground.