Visual 3D Process Infographic for Presentations
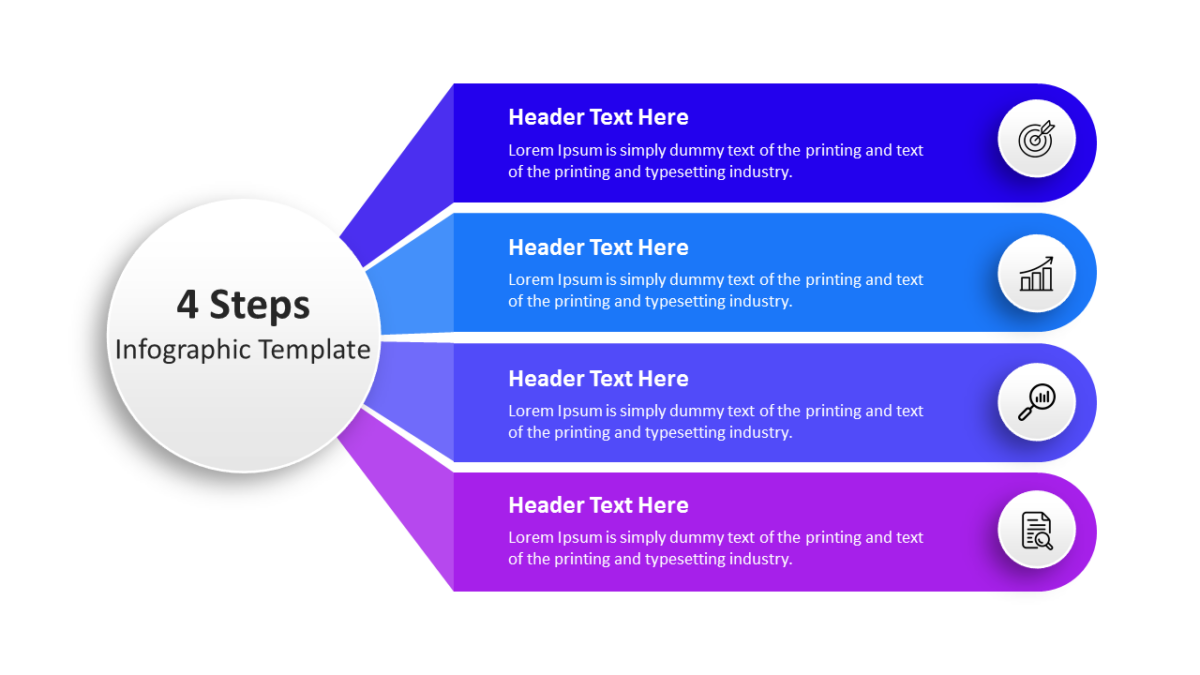
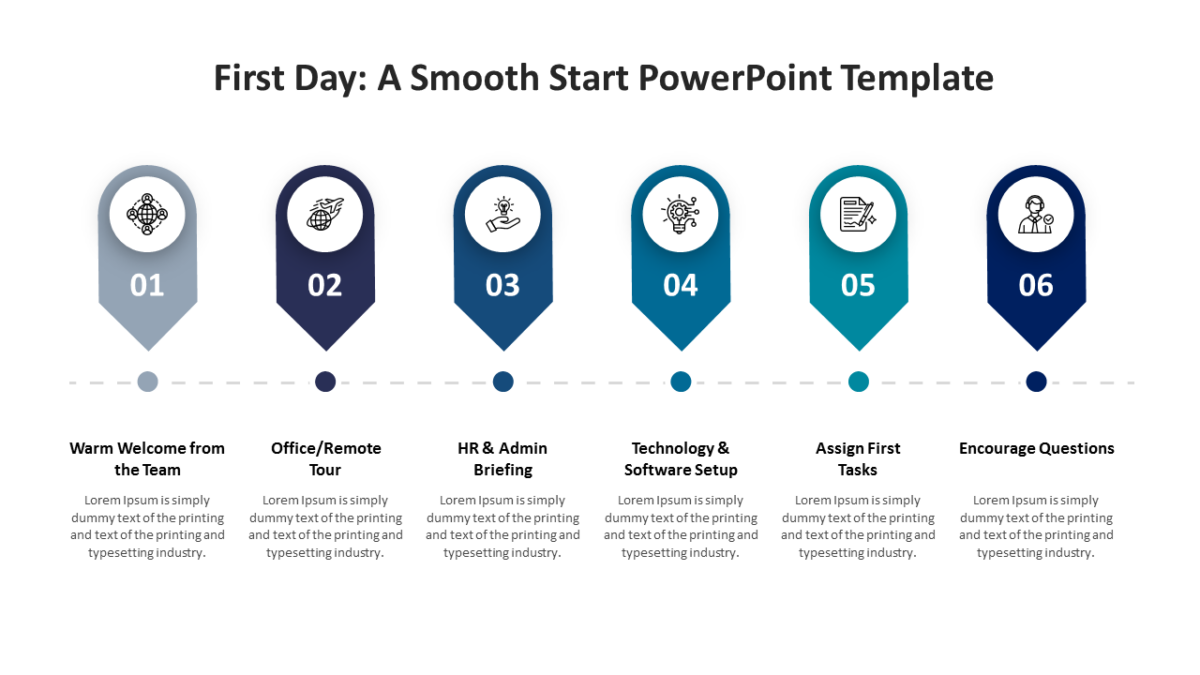
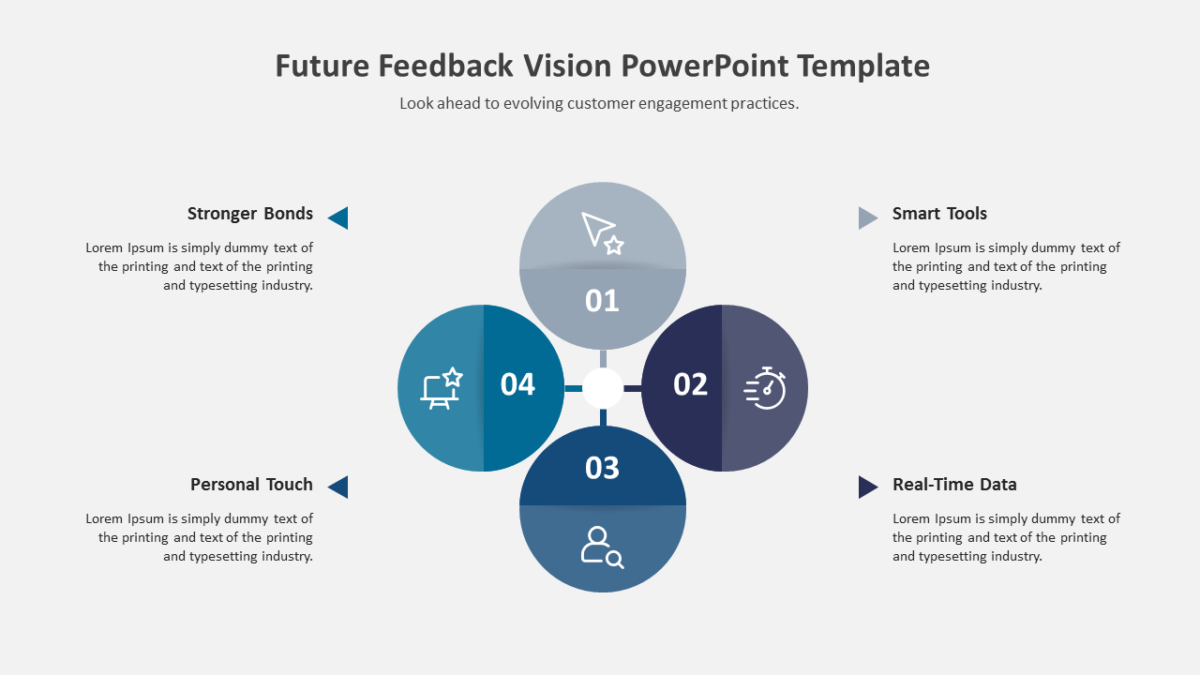
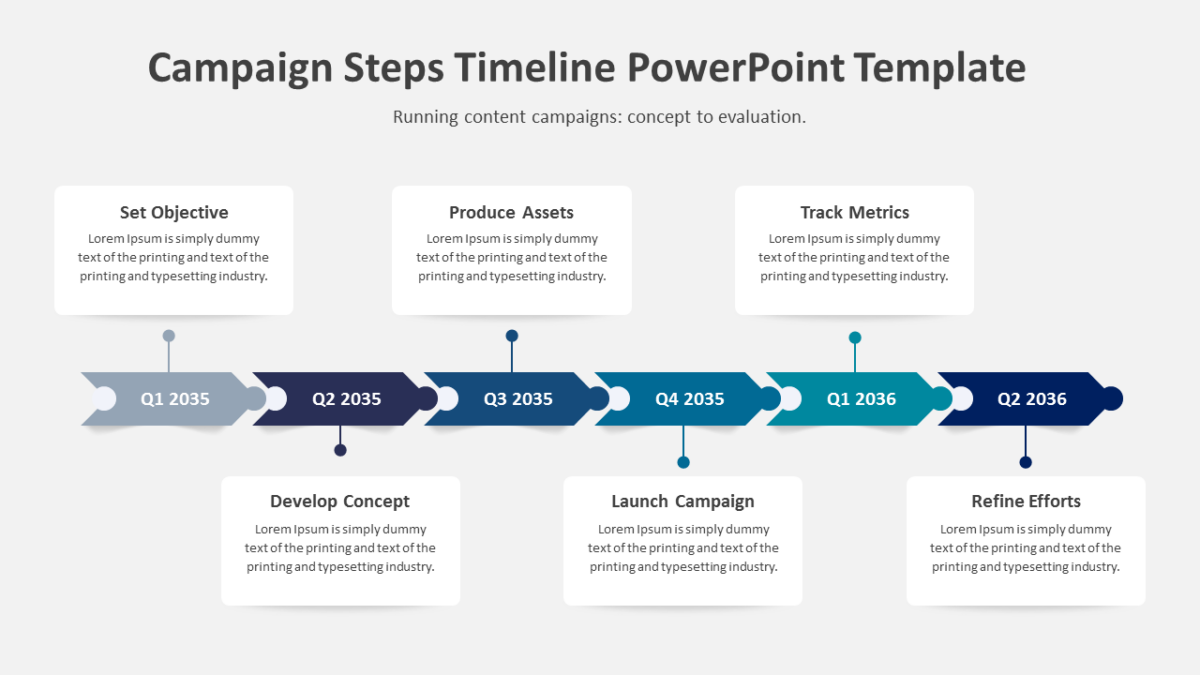
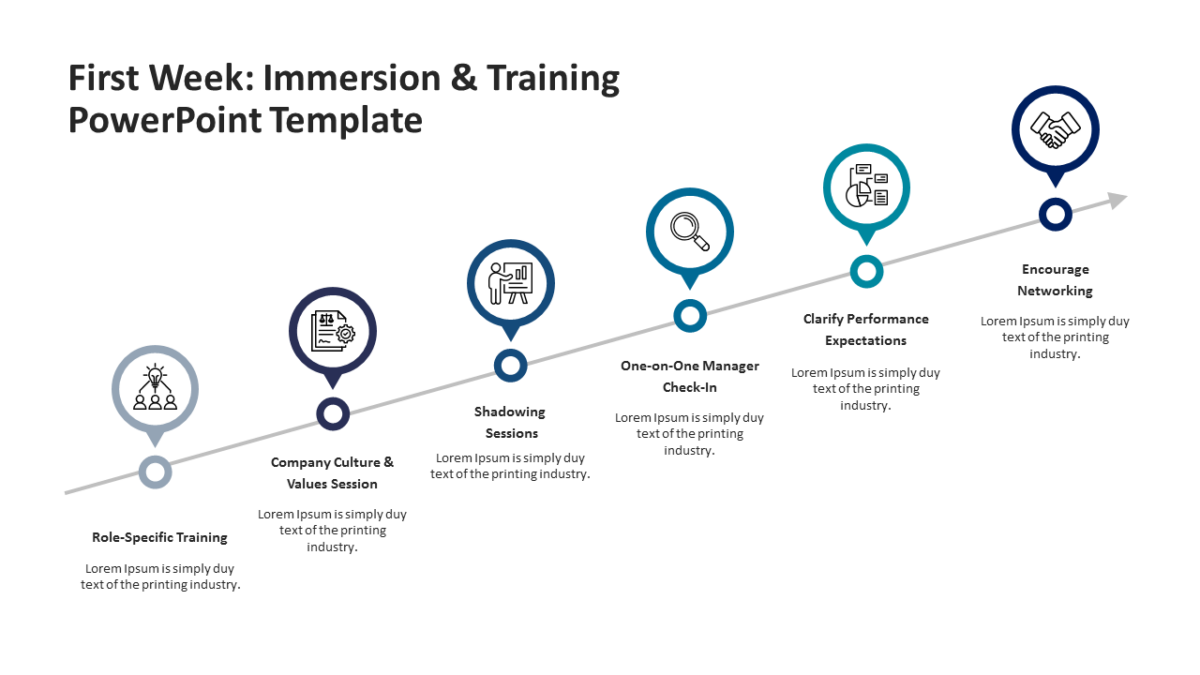
The Visual 3D Process Infographic for Presentations turns a set of steps into something the audience can point at and question.
Business audiences give a slide a few seconds before deciding whether to engage with it. Structure is what wins those seconds.
What’s on the slide
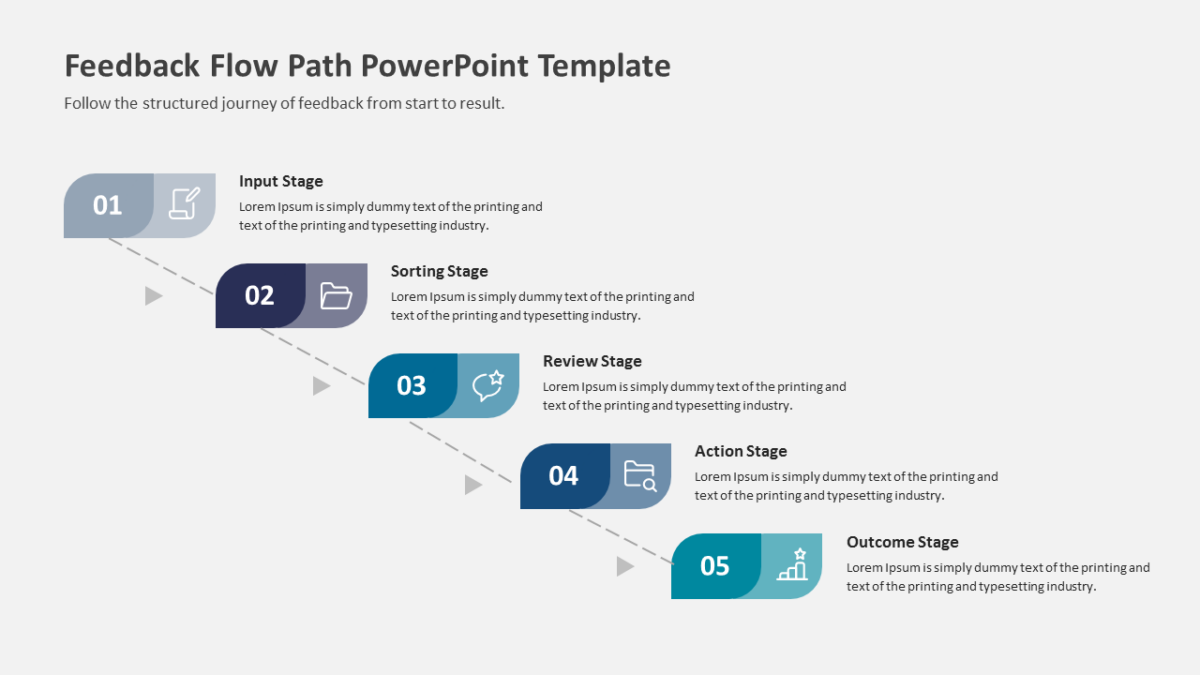
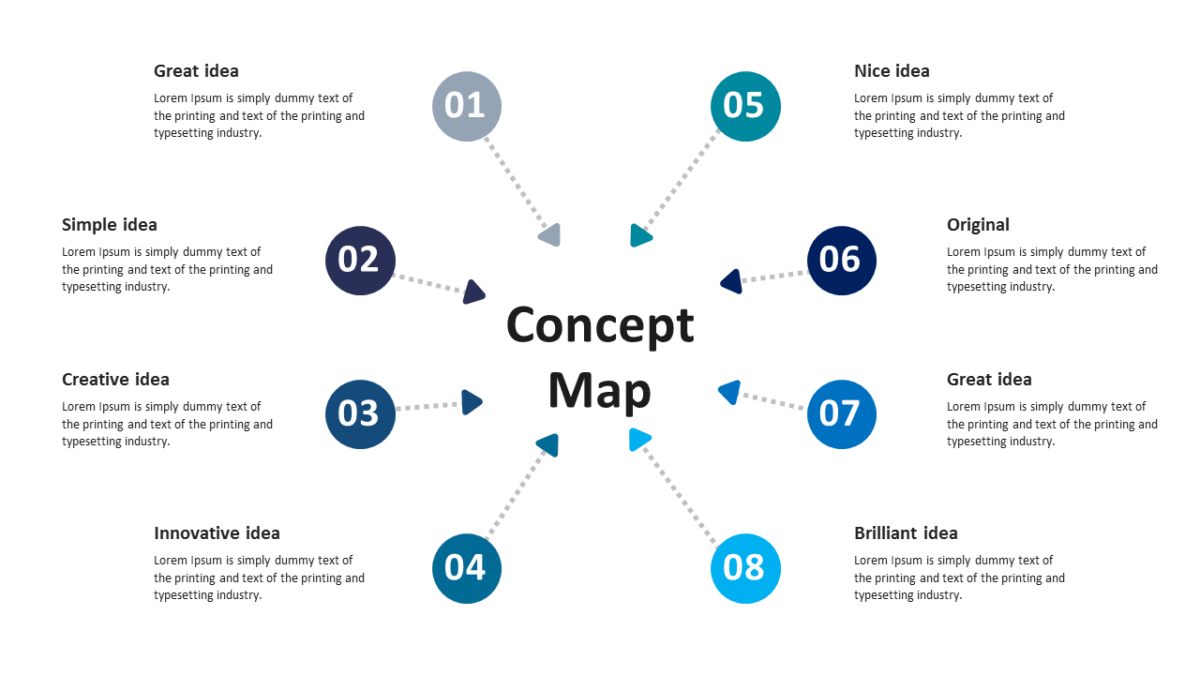
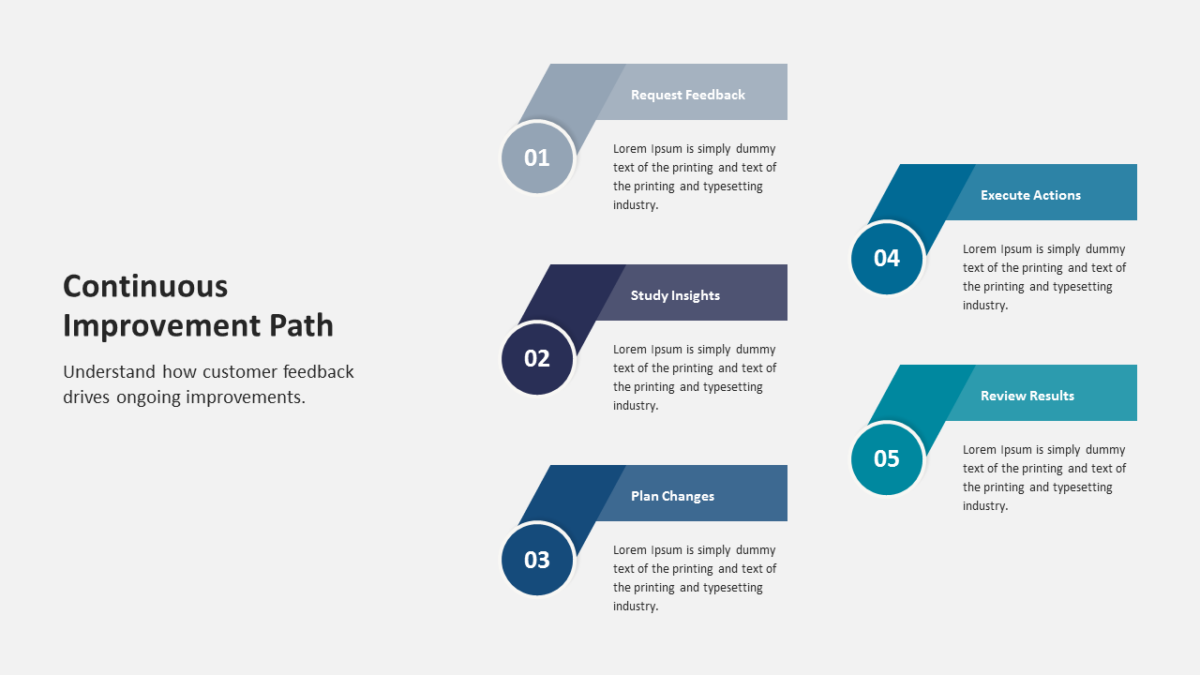
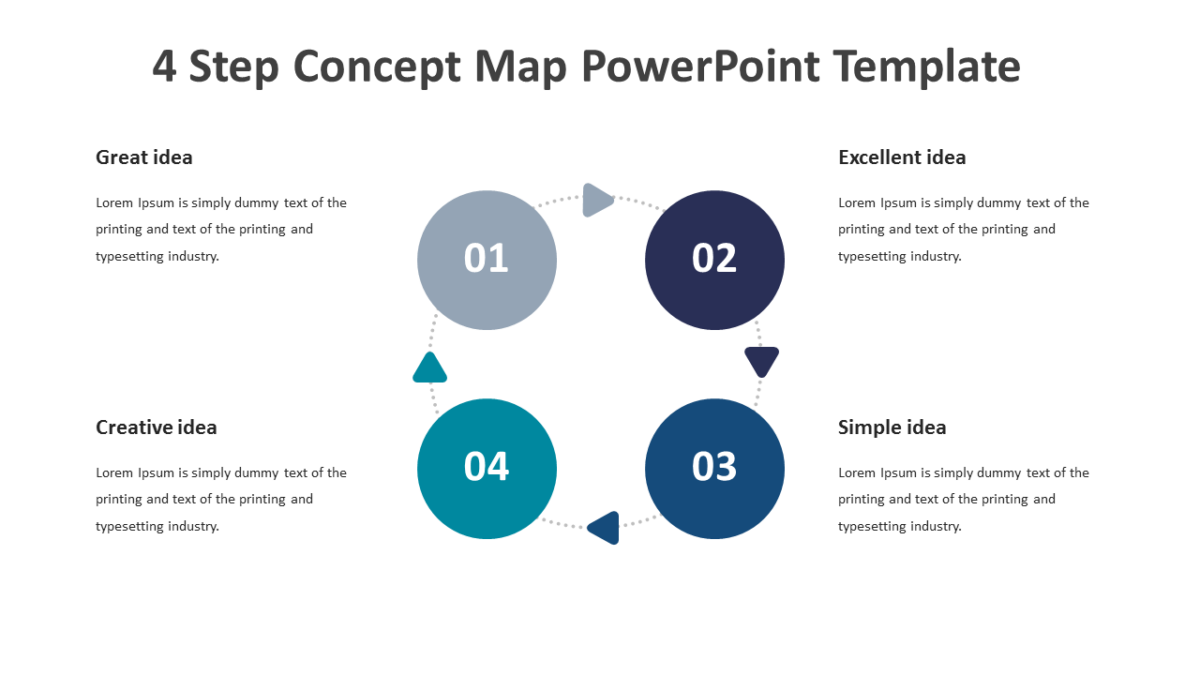
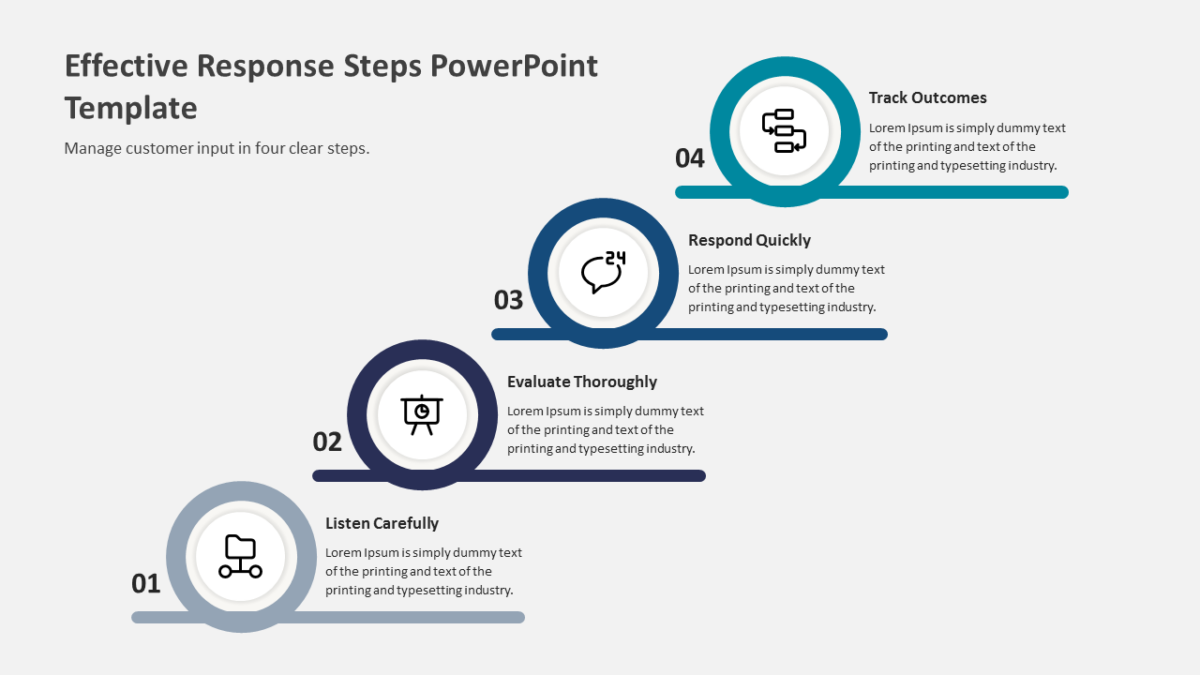
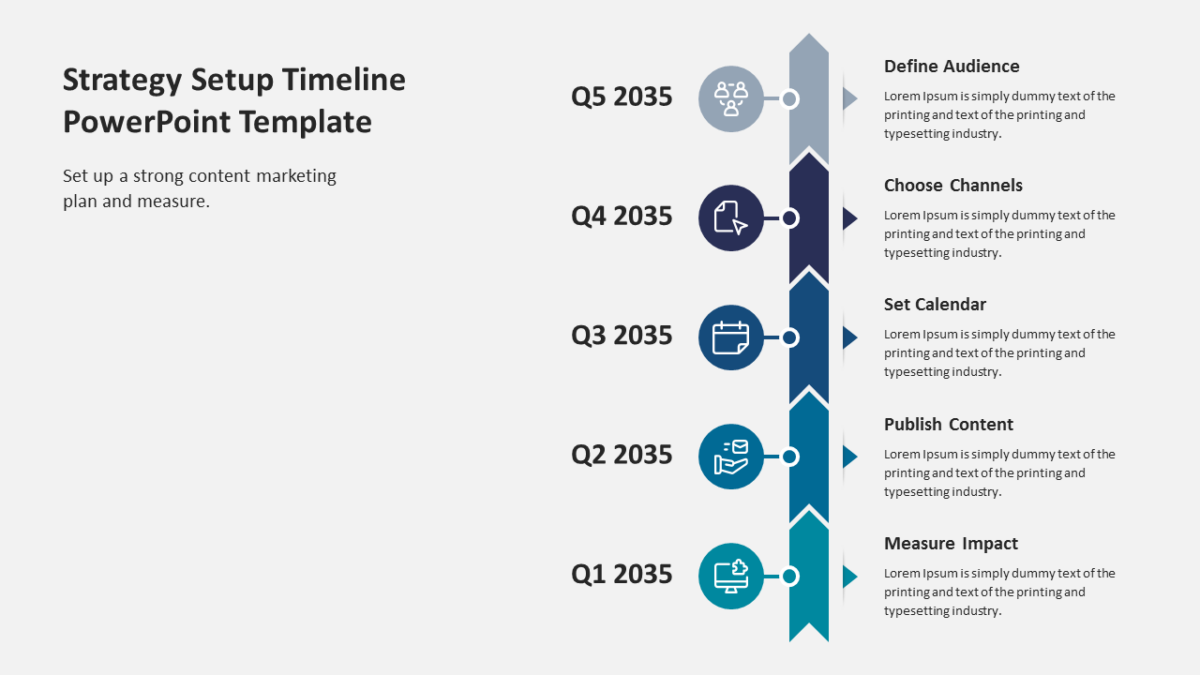
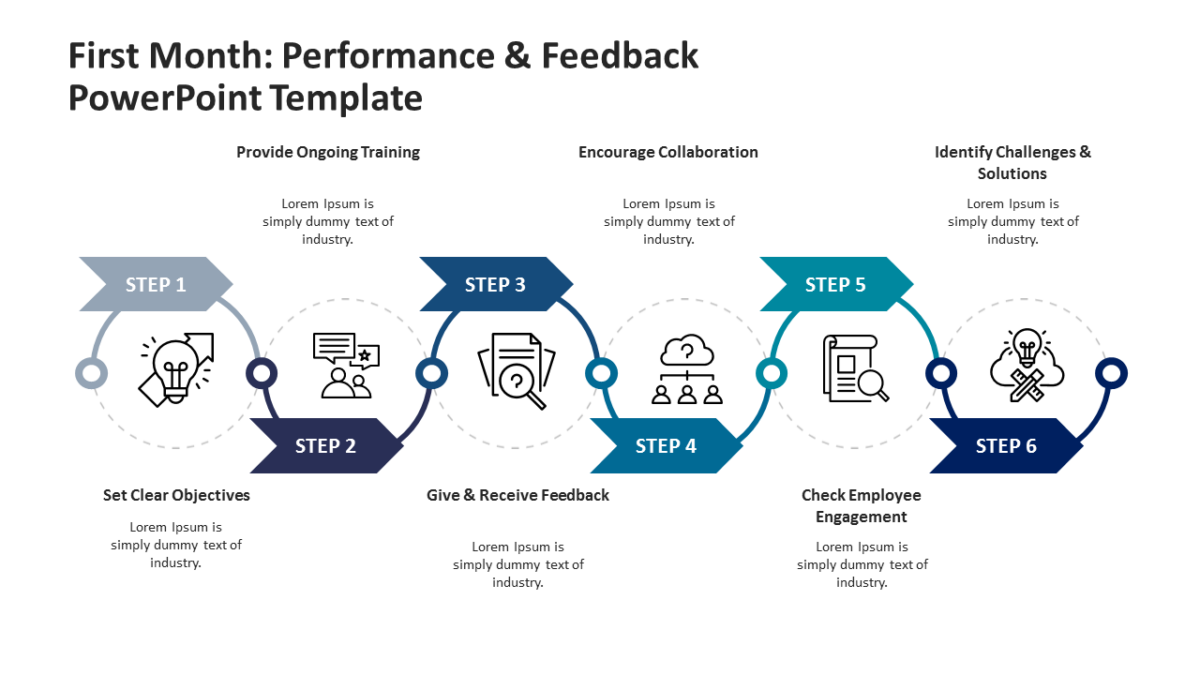
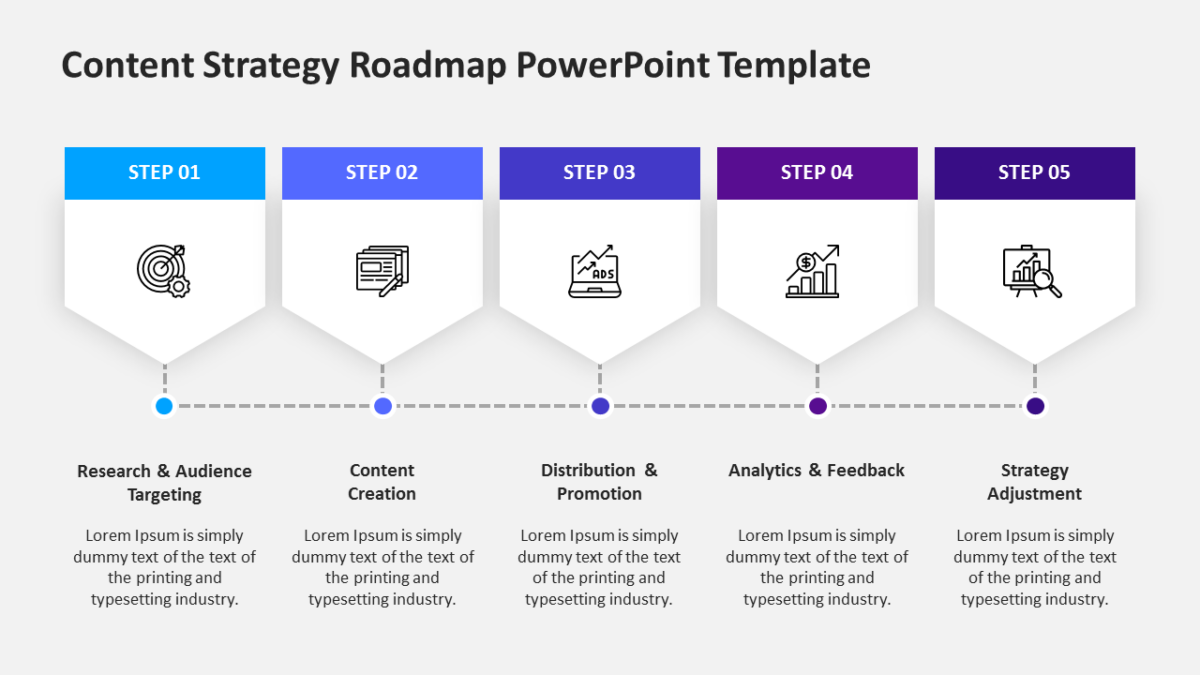
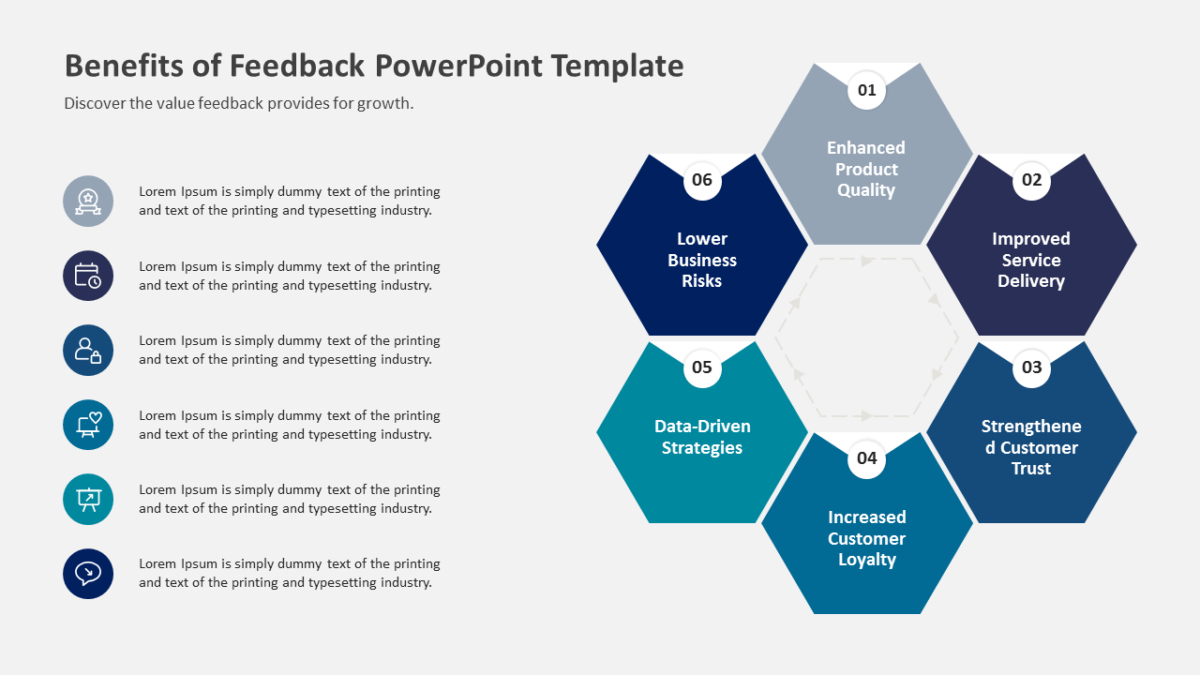
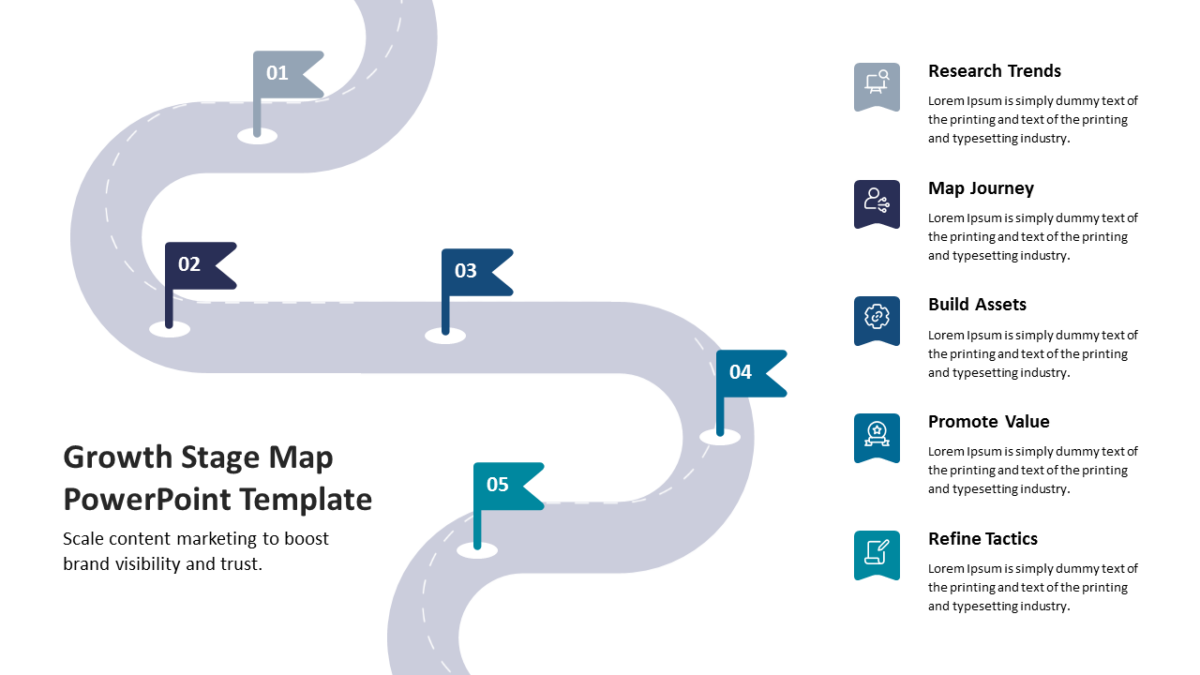
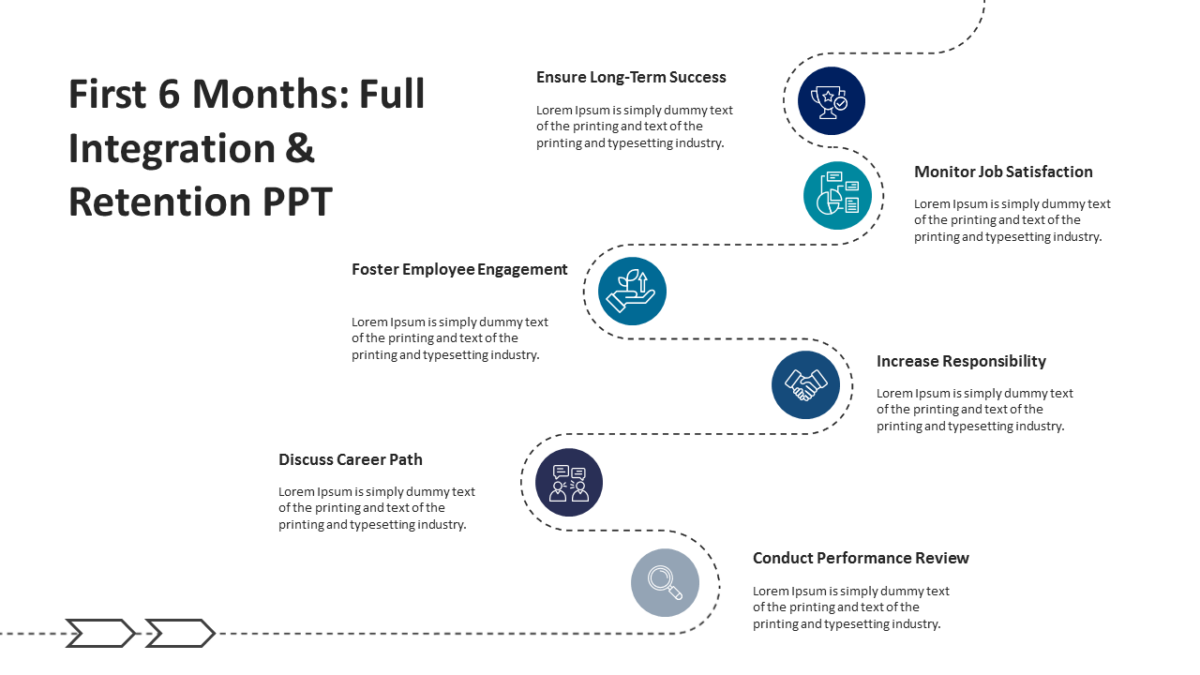
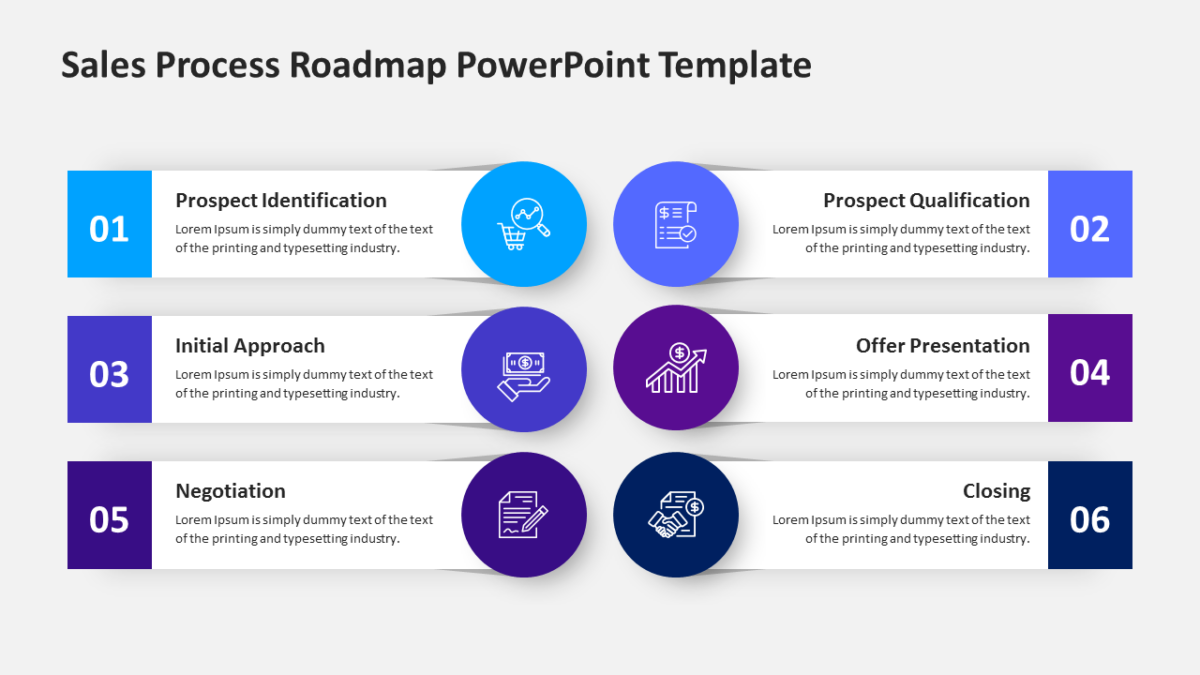
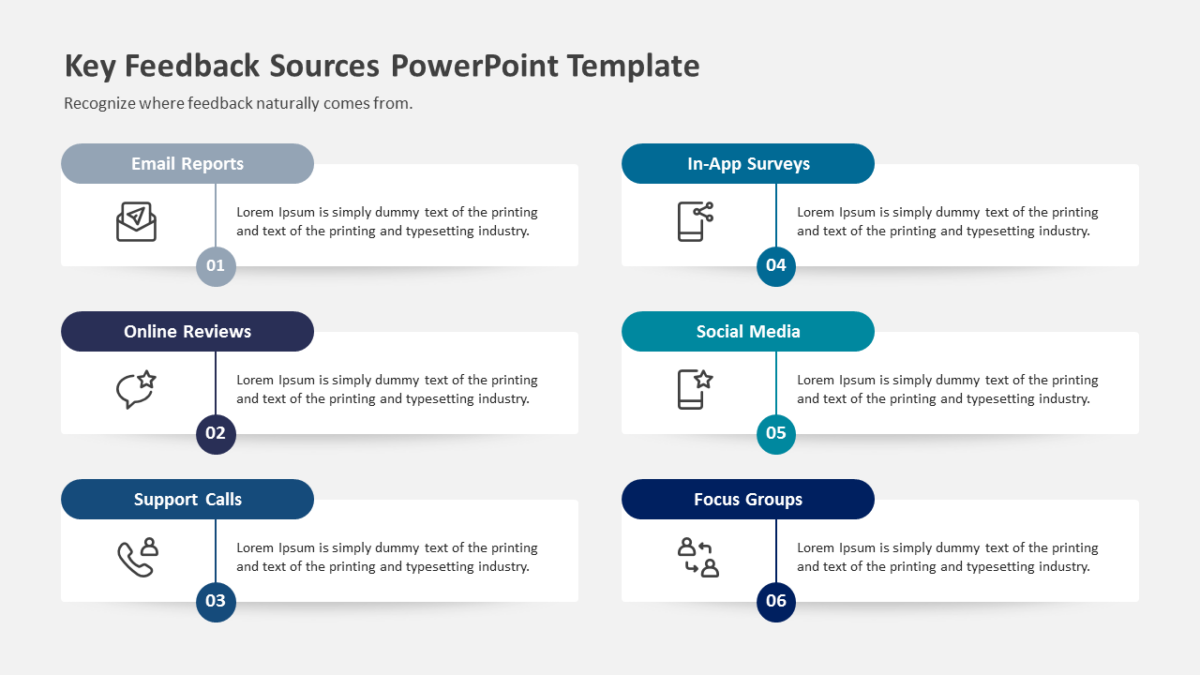
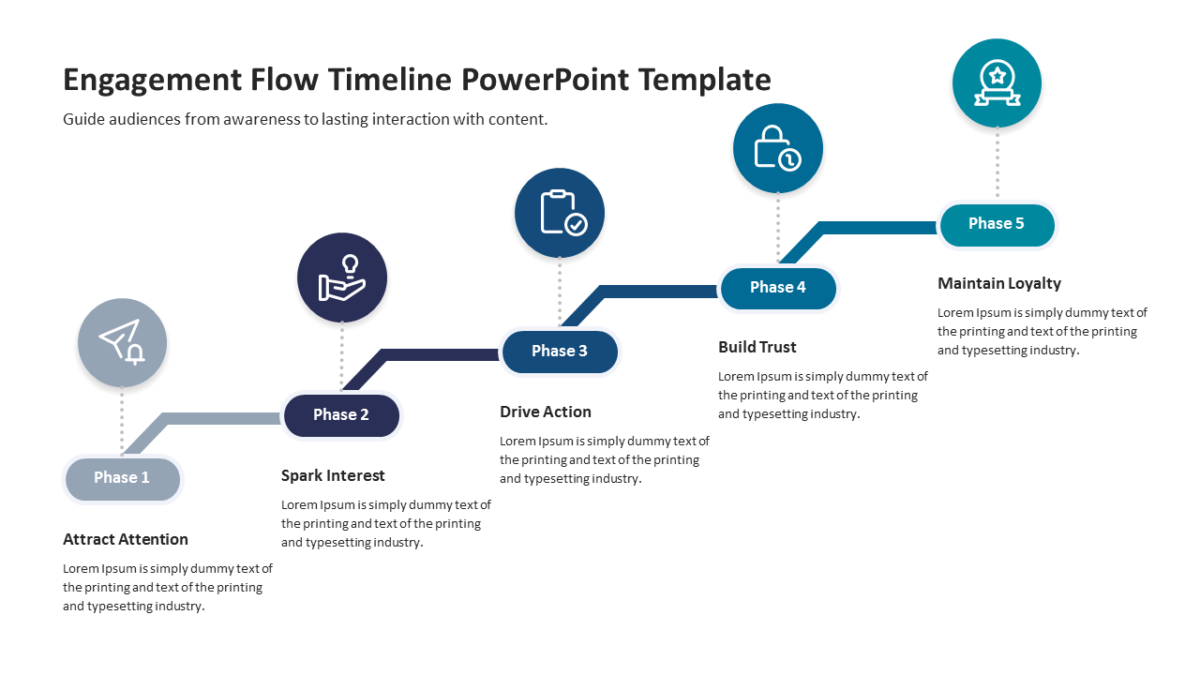
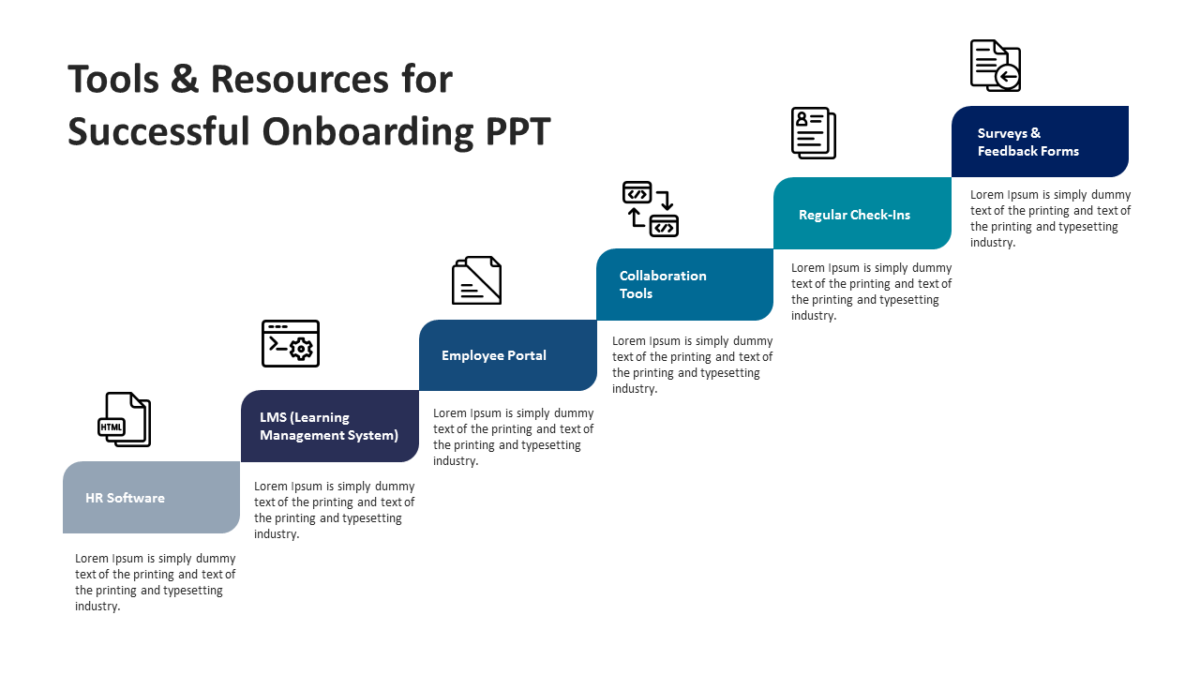
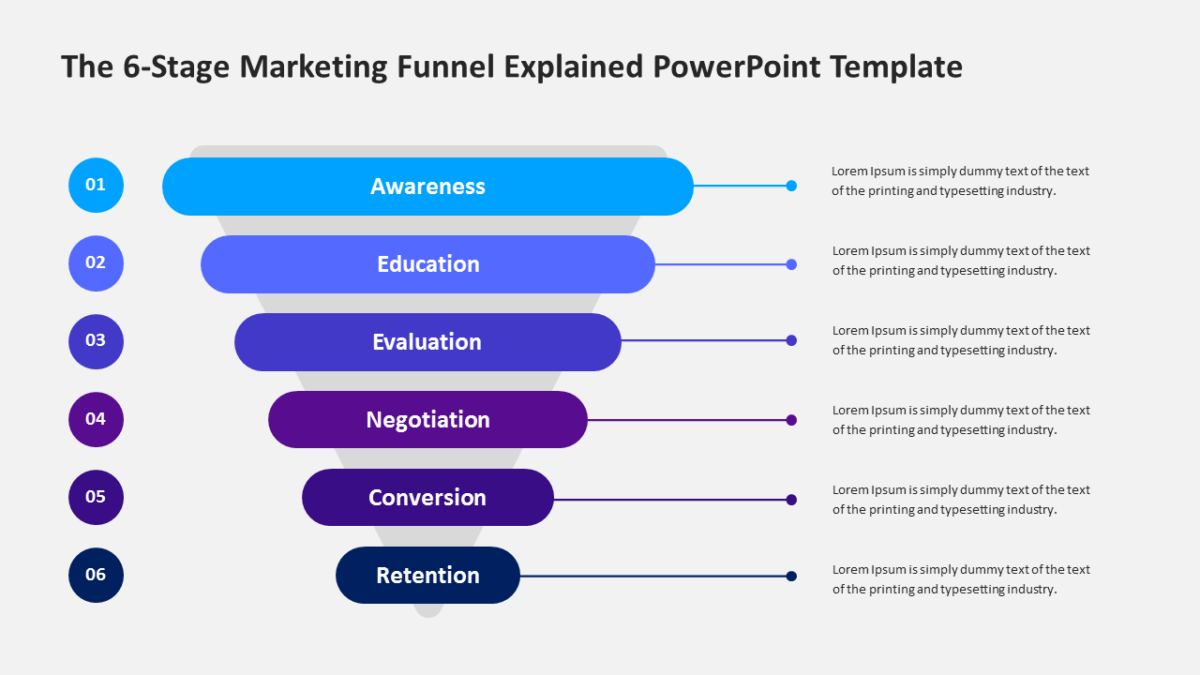
- Connected stages running across the slide, each numbered
- Connectors built into the graphic, so the sequence reads at a distance
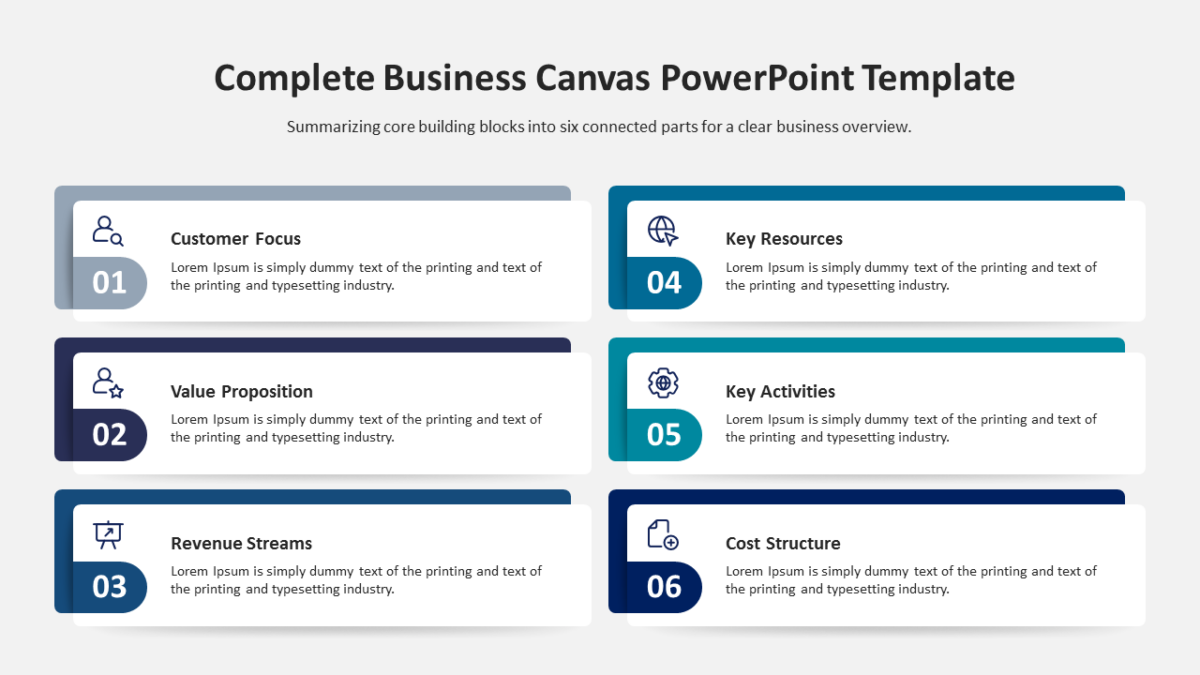
- Title and subtitle area at the top
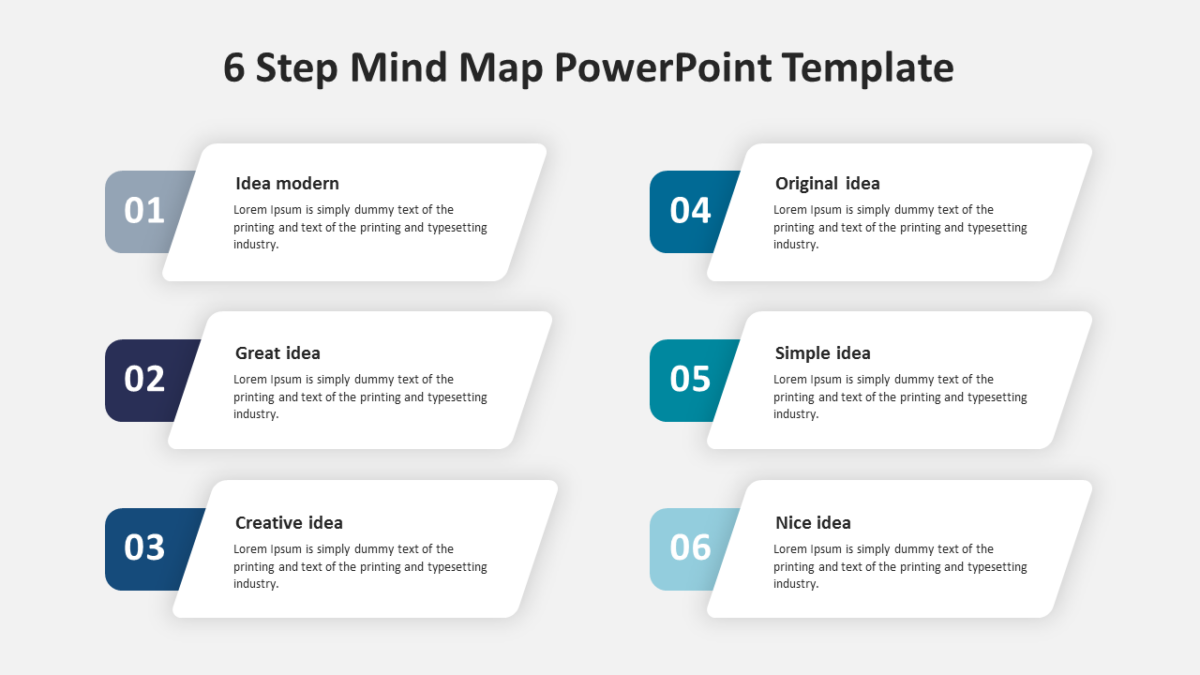
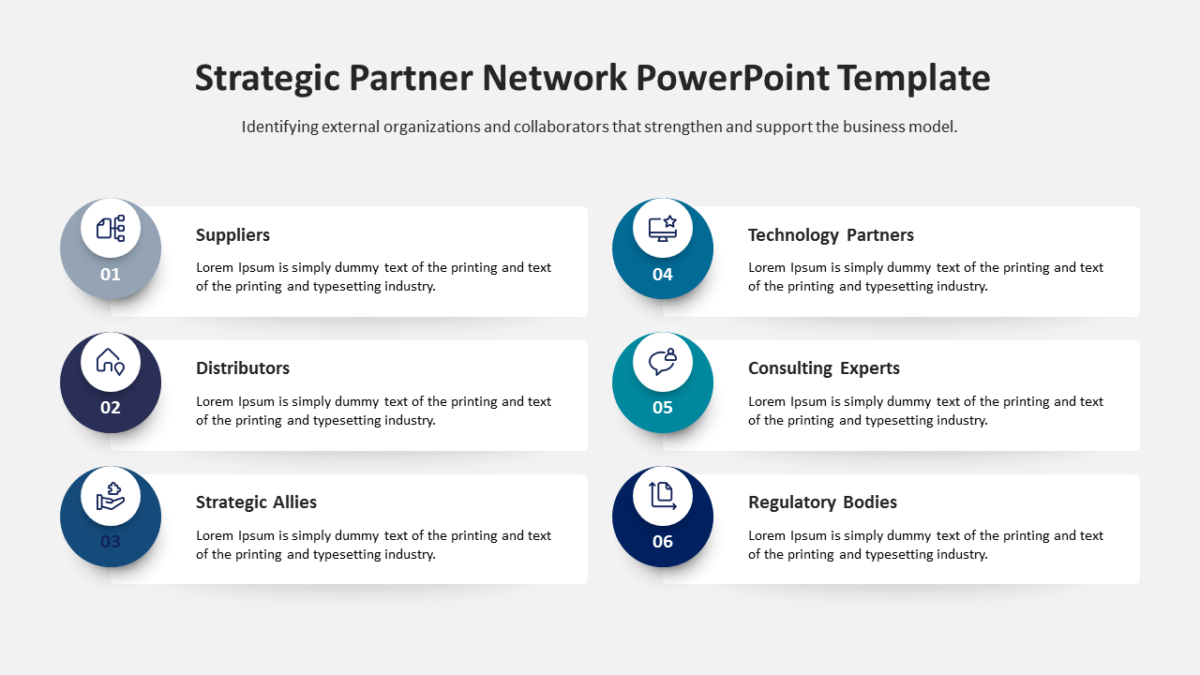
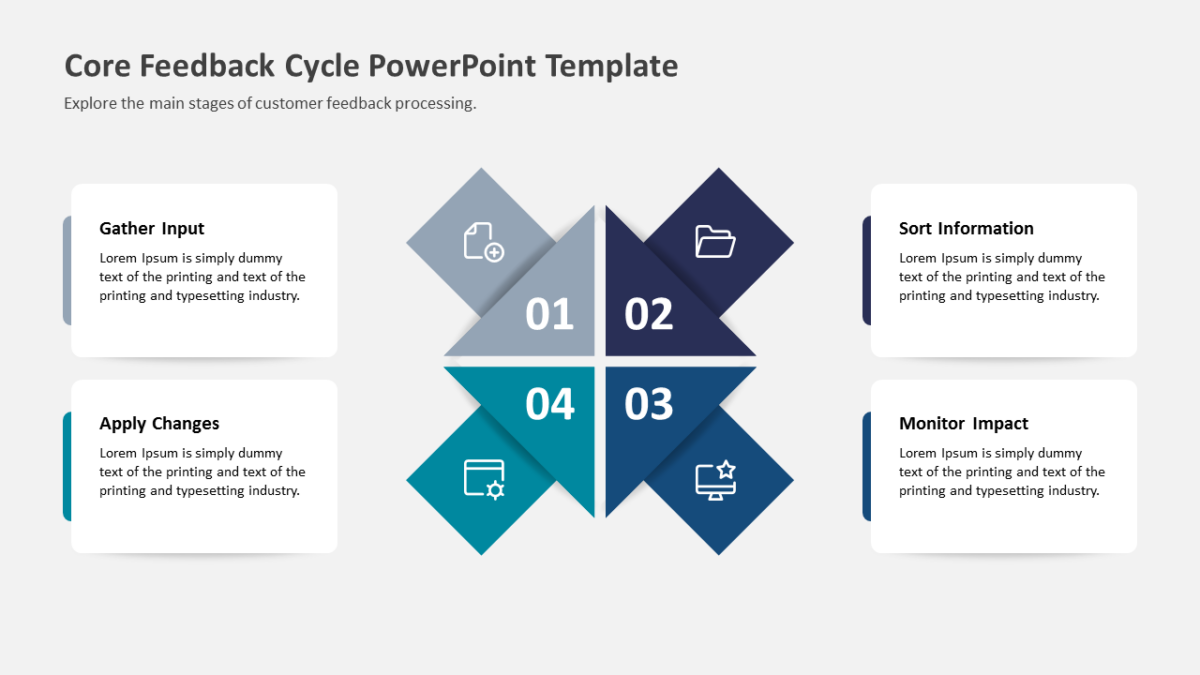
- A heading and short description block per step
- An icon placeholder on every stage
Fills, labels, icons and body copy are all editable. It ships at 16:9 and survives the trip into Google Slides or Keynote without breaking.
It lands with team leads first, then agency teams, and business analysts run into the same problem often enough to want it. Place it after your framing slide and before any results. For a different treatment of the same idea, the rest of the process flow templates are worth a look.